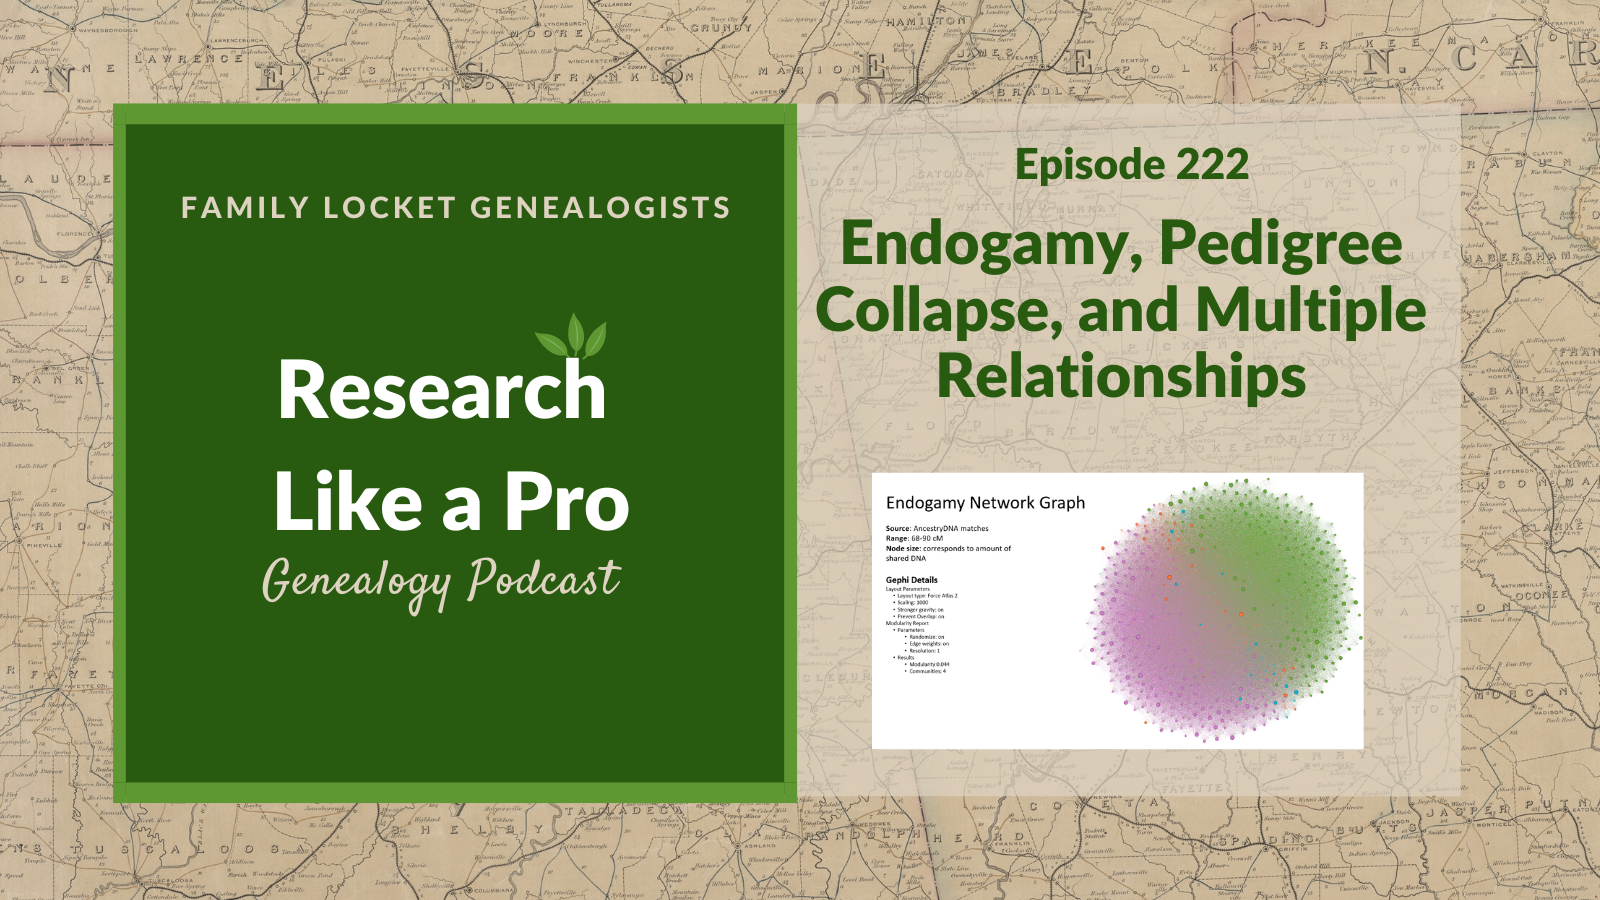
Today’s episode of Research Like a Pro is about the difference between endogamy, pedigree collapse, and multiple relationships. We discuss examples of each scenario and how it affects DNA matching and cluster analysis.
Transcript
Nicole (2s):
This is Research Like a Pro episode 222 Endogamy, Pedigree collapse and multiple relationships. Welcome to Research Like a Pro a Genealogy Podcast about taking your research to the next level, hosted by Nicole Dyer and Diana Elder accredited genealogy professional. Diana and Nicole are the mother-daughter team at FamilyLocket.com and the authors of Research Like a Pro A Genealogist Guide. With Robin Wirthlin they also co-authored the companion volume, Research Like a Pro with DNA. Join Diana and Nicole as they discuss how to stay organized, make progress in their research and solve difficult cases. Let’s go.
Nicole (42s):
Let’s go. Hi everyone. Welcome to Research like a Pro.
Diana (48s):
Hi Nicole. How are you doing today?
Nicole (51s):
Okay, I have been having so much fun doing DNA painter. It’s been a blast.
Diana (57s):
What are you doing with it?
Nicole (58s):
Well, I’ve just decided that I wanted to go ahead and paint all of grandpa elders matches from my heritage and it’s part of just an ongoing effort to find the best case study.
Diana (1m 12s):
Oh the case study.
Nicole (1m 15s):
And there is one line of his that I feel like would make a good case study. So I thought, well usually whenever I do like painting of segments, I find helpful matches and it helps me to think about possible conflicts or case studies. So anyways, I was doing that and I kind of came up with a really good system for quickly painting a lot of matches where I would filter by those that have a family relativity theory and then I will click on the triangulated match to go to the one to many browser and then you can like scroll to the bottom of that and copy and paste all of the segments from one of the peak matches.
Nicole (1m 57s):
And then another tip I figured out was that if you know how one person is related and then you scroll down to the shared matches and see that they have like a brother or a sister who’s also in your match list and maybe that person doesn’t have a tree, but since you know that they’re the brother of somebody who you know how they’re related, you can paint their segments.
Diana (2m 18s):
Oh that sounds like so much fun. I really like doing painting segments with on DNA painter. The only problem is you can get psyched into it can take a lot of time because it’s so fun.
Nicole (2m 29s):
Yeah, it is fun. Which is why I like to do it. You know when my kids and I are watching a movie and I am sitting in my chair with my laptop. Oh. Or I took the kids to McDonald’s yesterday for our fall break and they wanted to play in the play place for like two hours and we were the only ones there and I had my laptop, so hey free wifi. Oh
Diana (2m 49s):
That is great. That’s awesome. Way too multitask.
Nicole (2m 54s):
What about you? What’s been going on?
Diana (2m 56s):
Well I’ve been working on my client research, which is the project I’m doing for a research psycho pro study group. And we’re on the step of source analysis and the timeline and it’s been really good because I haven’t looked at this research for years. And so I dug out an old research log that I had actually done on research ties, remember years ago when I was experimenting with research ties. Oh see if I wanted to use that. And it was wonderful because it had preserved all my research. Well I saved the log I created on research ties as an Excel file and then I was able just to easily copy and paste that into air table.
Diana (3m 36s):
And then working on the source analysis made me look at everything again. And I added fans, you know, friends associates and neighbors to that field. And it helped me see a few avenues for future research or for my research plan actually, cuz we’ll be doing research planning in a few weeks here. And it made me really excited to think about what I wanna do to break down this brick wall of my clumsy Kline. So it was fun for me too this week to re revisiting some old research and when you put into a new program like Airtable and then you do some analysis, it really makes a difference in how you look at your case.
Nicole (4m 15s):
Yay, that’s good. I’ve been doing a timeline too and it’s for my research report for another person for the portfolio and it is really satisfying to put in all of the things, you know, into a timeline and think about each thing. And I did a deep dive into analyzing one of the records because it was one of the earliest known records for the person. And sometimes that can be the most important thing to look at and think about and wonder, be curious about what were the circumstances and who were the possible people that would’ve been around at this time that could have been his associates and that kind of thing.
Diana (4m 51s):
Exactly. And we’re always looking at the community when we’re looking at these early settlements and thinking that exact same thing. Why did they go there? And in, in Clemson’s case, she’s in Morgan County, Missouri in 1850, but I have her husband on a tax list of 1839 in Isard County, Arkansas. So you know, that’s just, it’s just across the border, I mean and up a bit. So it makes sense that there was a migration, but I’m wondering why did the WeatherFords move up there? Clumsy is married to Weatherford and on the same census as Clumsy is a Jacob Klein and she has a couple clients in her household, so I’m almost positive that it’s her brother.
Diana (5m 34s):
It would just make sense that they maybe needed a new place to move and they wanted to go live for a time near her brother. I don’t know because they don’t even stay in Missouri then the next time we find them it’s in Texas. Hmm. So they have this brief stopover in Missouri I’m guessing. So I am really looking at this with migration and the community and thinking about why they would’ve moved. So I’ve got a couple of different research localities I’m thinking of doing, which would be the Arkansas locality and Missouri just to try to figure out what was going on there.
Nicole (6m 7s):
Yeah, it’s so great to see the migration pathway and think about possible reasons why they were stopping in these places and the brother sounds like a really good reason.
Diana (6m 18s):
Yeah and it’s a huge clue and I’ve known he was there but I just hadn’t taken the time to do a project on him. And online trees do have a possible father for him. We do know that they’re out of Virginia so that’s helpful, but it’s gonna take a little bit more work to connect them because I think they did the Virginia, Tennessee, the Missouri thing
Nicole (6m 43s):
And Tennessee is sometimes a black hole of records. Yeah,
Diana (6m 46s):
That’s what, that’s probably why this is a brick wall because we had the Tennessee stop over for a bit, but luckily there is a fairly decent fan club. Her brother Jacob Klein married to the ard a r d and so I’m thinking, you know, following the ARDS can help us find the right clients in Tennessee. You know, I’m just, just gonna follow this back, see what I can find.
Nicole (7m 11s):
Great. Good job.
Diana (7m 13s):
Yeah, we’ll jump into our topic of the day, which is figuring out the difference between Endy pedigree collapse or multiple relationships. And we see this come up when we’re doing the DNA study group with people doing the leads chart or looking at their match list or doing a network graph and seeing all these connections and sometimes just jumping to the conclusion that they’ve got pedigree collapse or end domy in their lines. So we wanted to do some really good analysis and some good definitions about how to separate out those terms and how to understand what you really are seeing in your match list.
Diana (7m 57s):
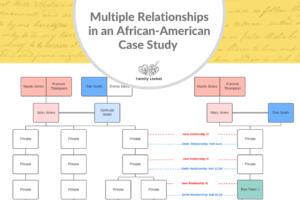
So in this podcast we’ll just kind of do a brief overview of each one of those and then in future podcasts we’ll go in more into each one and discuss each term in a little bit more depth. So let’s start with multiple relationships and this is the least complicated and I think it’s one of the most prevalent states that we have seen. So this occurs when you’re related to someone on more than one of your family lines. So you have multiple common ancestral couples and you may not even know about this until your DNA looks a little odd or you do more research and then you discover it. So for example, my great-grandparents do Als Fraser had siblings that married doc’s sister Sophie Harris married Alice’s brother Miller Frazier.
Diana (8m 44s):
And I knew that from my research years ago and that was pretty clear. And when I wanted to diagram that out, you know on Luci chart that’s when, when it gets a little tricky is figuring out how to show that. And so the diagram shows me with my connection back to Doc and Alice and then their parents and then the diagram also shows my three DNA matches who come down from that sibling couple of Sophie Harrison, Miller Frazier. And so it makes a little bit easier to see when you have it all charted out.
Diana (9m 24s):
It’s a wonderful thing to have it in your family tree. It’s even better to use a diagram whether it’s paper and pencil or you know, something like chart to get it out there so you can see how you and these DNA matches connect.
Nicole (9m 40s):
Yeah, drawing it out is really helpful but also frustrating because you can’t really draw it easily without overlapping crossing lines where Right. And then it gets confusing. So for the example in this blog post, we opted to just add in the ancestral couples twice so that you could see, okay, Sophie’s parents are John Harris and Melissa Welch and Docs Harris are also John Harris and Melissa Wedge. And those two parents are in the diagram twice and they’re colored pink. Same with the Frazier Brisco couple. One thing that that diagram shows is that like pedigree collapse when there’s multiple relationships it could cause an inflated amount of shared DNA because you’re inheriting DNA from the same ancestral couple.
Nicole (10m 26s):
And so although it’s a little bit different, you know different cause has a similar result. Going back to our example, if like we talked about this, these descendants of Miller and Sophie share DNA with descendants of Doc and Alice because you know siblings of the Harris family married siblings of the Frazier family, then their descendants are gonna share more DNA than expected. So that’s kind of the hypothesis that you would have. And this is because they have both of the ancestral couples in common. And so an important step in analyzing DNA matches is to view the histogram for the proposed relationships using the Shared Cinema Morgan project by Blaine Bettger and hosted at DNA painter.
Nicole (11m 12s):
So for our example, this siblings marrying siblings from the Harris family and the Frazier family, they would be third cousins, then they’re also third cousins again, so third cousins through the Harris and then third cousins through the Frazier family. And so they’re double third cousins. But if you didn’t know that and if you just thought they were regular third cousins, what would the the histogram look like and what the DNA kind of be off the chart? You’ll have to look at the blog post to see the picture of the histogram, but looks kind of like a bar graph. And the way that it works is that you put in the amount of shared DNA and then on DNA painter, that tool there, it will put an arrow on that relationship histogram for where that amount of DNA fits in the all these submissions and the numbers across the bottom of the histogram represent the amount of shared DNA and the numbers upon the vertical access on the left side represent the number of people reporting that amount for the relationships of third cousin.
Nicole (12m 15s):
So for the third cousin relationship, the mean amount of shared DNA is 73 cent Morgans and the three cousins who are double cousins with Diana are ninety one, one hundred and five and 108 cent Morgans. So they are above the mean. All of them are. And typically what you would expect for three third cousins is that some would be below, some would be above and some would be, you know, around the mean. And with all three of them being above the mean, that’s a little bit of an indication to you that okay, maybe there’s something else going on here. Another measure to look at is whether the matches are within one standard deviation of the mean.
Nicole (12m 55s):
The standard deviation for the third cousin relationship is 43. So one standard deviation above the mean is 116. All of these double third cousins fall within one standard deviation above the mean. So the extra amount of DNA from the two shared ancestral couples wasn’t enough to make them an obvious outlier.
Diana (13m 14s):
Right. And the only reason I figured it out was I was looking at shared matches and I went, oh, they’re sharing on this line and this line. And so you know, sometimes your shared matches will help you see that and then you can go do some more genealogy and figure it out and then do this analysis. So what is the conclusion from this? Well what I found was that double relationships may not affect the DNA so much that it changes the relationship estimate because they all came in at third cousins even though they were double third cousins. But that’s a little bit more distant, right? So if you share on more than just two relationships, you may have a greater effect on the shared dna.
Diana (13m 58s):
One of our Fraser cousins shared her DNA with us and she’s two generations closer to our Fraser shared ancestor and she has a DNA match on our Fraser side who appears at first glance to be a third cousin once removed through the Fraser MA Christian line. But you found Nicole that they actually share four common ancestral couples, which is crazy and this is in the south, you know, and the small area. So it kind of makes sense if they stay there, they’re going to have multiple ancestral couples. But we have John Clanton and Nancy John Briscoe and Margaret Looney, Robert mc Christian and his wife who we don’t know her name, James Fraser and Nancy Lane.
Diana (14m 39s):
And so this would be a quadruple cousin, third cousin once removed three times a fourth cousin one time. So this match and this Fraser cousin share 153 cent Morgans, which is on the very to possibility for a third cousin once removed. So whenever you see something that’s out there on the edge sharing more dna, then you think you might want to look at the pedigree and see if there are multiple relationships that you had never noticed. And it is fun to do that. It might be a little tricky if you have to build the tree yourself, but we’re always trying to figure out the common ancestor between our test taker and DNA match.
Diana (15m 26s):
So one of the things that we can do is do some clustering and the companies have some tools, the shared matching tools or there’s also third party tools and it really might mess you up with looking at your clusters if you have these multiple relationships because they’re not going to separate out clearly. And this is what we’ve seen in the study group that people will do a network graph or an auto cluster and then they’re confused because they see so much sharing between their clusters and they just automatically jump to endy or pedigree collapse when in reality it could be multiple relationships.
Nicole (16m 6s):
Yes, exactly. And I think we’ve all been confused about that before, like why are these two clusters so tightly connected when they have different common ancestral couples, what’s going on? And so it is helpful to really dive in and look at each match carefully and see, okay, even though there’s only one theory of family relativity, is there another common ancestor or common ancestor hand if you’re using the ancestry? And ancestry is pretty good about giving you multiple common ancestral hints when there’s two ancestral couples in common. So make sure you always look at that. And my heritage does that too. They do give you multiple of the theories of family relativity. I just have found that sometimes those are a little bit less accurate than ancestry and sometimes they don’t have all of the common ancestor hints there at my heritage, but they’re still really helpful.
Nicole (16m 53s):
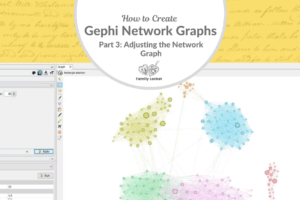
Anyways, let’s talk about a network graph that shows DNA matches and the shared matches are shown as lines connecting the nodes and groups of matches who have many connections to each other are called clusters or communities. And I make the network graphs using gey. And so in gey they’re called communities anyway. These clusters usually mean that the group of matches share an ancestral line and many of them share the same mrca couple. What we did is we made a network graph of Diana’s matches, then we analyzed each of the clusters to try to figure out which one belonged to which side of her family, her four grandparent couples, and we just focused on a smaller range of DNA matches to make the network graph more tenable.
Nicole (17m 39s):
So it was 35 cents up to 268 cents and we saw that her two maternal great grandparent couples were kind of on one side of the graph and there was like another side of the graph that had some of the paternal great grandparent clusters and another cluster was further back on the paternal side. One thing that was interesting is that we could see a connection between that further back paternal cluster and the closer in paternal cluster. So that’s what you normally expect to see in a network graph. What we wanted to analyze was were these double cousins and how they affect the clustering in the network graph.
Nicole (18m 22s):
We found the Harris Fraser double cousins in one of the clusters and then we also found an interesting match in the center of the graph who actually shared with the maternal side and the paternal side of Diana’s network graph. And so that was funny because it’s like the one person in her match list that connects to both her paternal and maternal lines and they’re, they’re double cousins and they share the career Morris ancestral couple on the maternal side and the Roy Dan Weatherford ancestral couple on the other side. So the result of that is that it makes the cluster number one, which is maternal and cluster number five, which is paternal appear to be connected when actually it’s not. It just, there’s just one person who is is in both clusters basically.
Diana (19m 7s):
And I remember being so puzzled when I was looking at that match and looking at the shared matches, I was like, what these two lines don’t cross my dad’s out of the south and my mom’s lines are out of Denmark in England, but there was this one cousin where we actually did have ancestors on both sides, so that was really fun. Yeah, and of course if your parents, they’re both from the same community, you’re gonna have a lot more crossover. I just am lucky that I don’t have that hardly at all.
Nicole (19m 39s):
Yeah, and if we would’ve gone down to lower number of Cent Morgans, we would’ve seen like two distinct clusters for the Harris and then the Fraser and then the overlap between them with the double cousins. But because we stopped at 35 Santa Morgans, then it just kind of clustered nicely into a big group of all the Harris and the Frazier cousins into one cluster. Yeah. So yeah, when I made a network graph for you that went down a lot lower to like 15 or 10 cent Morgans, you remember how messy that was, right?
Diana (20m 9s):
Oh yeah,
Nicole (20m 10s):
Yeah. And that was showing a lot of crossing over between those two clusters where we have the double cousin relationships,
Diana (20m 18s):
Right? And I had really erroneously decided it was pedigree collapse just because it was southern ancestry. So you know, a big takeaway for this for us was to be careful not to confuse multiple relationships with pedigree collapse. And you really have to build complete trees for your matches because you don’t know what’s in their tree unless you look and they may not even know if they haven’t built it out far enough. And one of the ways you can have a suspicion about this is evaluating each of those matches with the shared cinema organ project tool and seeing if it’s inflated, is it out there on the edge of that histogram?
Diana (20m 58s):
And then keep in mind that the amount of shared DNA will be affected more in closer relationships than indent ones. And in cousins who share many common ancestors,
Nicole (21m 8s):
Right? So not just double cousins but quadruple cousins,
Diana (21m 11s):
Right? And if you’re out there and it’s like a third cousin or a fourth cousin and you’re sharing at that distance, it’s really likely that there has just been enough segment loss that it’s not going to affect it much. You’ll really see it in your network graph if you go down to the 10 or 15 cent Morgans. But anyway, it’ll just be fun to explore that and see how it works in your own dna. Right. All right, well let’s talk about pedigree collapse. And this is different than what we’ve been talking about with multiple relationships. So in my example of double cousins, I didn’t have pedigree collapse, I just shared two sets of common ancestors with some of my DNA matches.
Diana (21m 53s):
Now pedigree collapse occurs when cousins reproduce and their descendants have ancestors in more than one place in the family tree. If this happens over and over again from many generations it can become endy. But if you just have two or three instances that doesn’t really qualify the situation as end domy. So how does pedigree collapse affect DNA matching? Well, it can affect the amount of shared DNA with closer matches just like in multiple relationships, but the effects do fade quickly because of that same segment loss in each generation. And so it will not have a significant effect on downstream matching.
Diana (22m 34s):
We have a diagram that shows an example where we’ve got a John Clark and a Mary Law clear that are both Donna’s paternal second great grandparents and her maternal great grandparents. So her parents are first cousins on the maternal side and first cousins once removed on the paternal side. So this same couple John and Mary appeared twice in Donna’s tree and that is classic pedigree collapse. So what does DNA look like with pedigree collapse? You have to look at the family tree and it will show up in a fan chart.
Diana (23m 19s):
Or if you’re doing a diagram, you know it’ll show up in your own diagram. If you have it in your own tree, you’ll probably know it, but you may not know it for all the other people’s DNA that you work with.
Nicole (23m 30s):
Right. And that’s a really good point that even if you don’t have pedigree collapse in your tree, if you share an ancestor with a DNA match who has that ancestor in their tree twice, they’re going to get an inflated amount of DNA from that ancestral couple. And so, so they might share an inflated amount of DNA with you, right? And so you have to check that for your matches too. And then of course if you both have that ancestor in your tree twice, you can see how quickly that escalates the amount of dna. So something to look at. And so in our example, an example from a woman who will call Donna, she had the same ancestral couple on both her maternal and her paternal side. Like Diana said, it was pretty close, like it was her first great grandparents and second great grandparents on the other side when there was a DNA match who descended from that couple who’s in her tree twice, you would expect for that amount of DNA to be inflated.
Nicole (24m 24s):
What you’d wanna do is check the shared Santa Morgan project. You can check the tool or the PDF and then view the histograms for the two relationships. So on the one side, on the paternal side, she’s the second cousin, one’s removed. And then on the maternal side, the DNA match, Joan is the second cousin twice removed to Donna. So viewing the histograms for those two relationships and looking where 225 Centor falls on the histogram, it shows that that’s higher than what’s expected, but still within the range. But it is pretty far from the mean. For example, the second cousin twice removed relationship, the mean is 71 and one standard deviation above the mean is 113, but she’s sharing all the way up at 225 set of organs.
Nicole (25m 17s):
So this is just a perfect example of how pedigree collapse can cause an inflated amount of shared dna. So if you see someone sharing on the high end of what’s expected for that relationship, when you look at the histogram, then just consider they might have another path back to the same ancestral couple. And so mapping out both of those paths can help you see that they had different ways of inheriting DNA from the same ancestral couple who’s in their tree twice. So what does pedigree collapse look like in a network graph? When you look at our blog post, you can see the image of Donna’s network graph and see how the clusters are very connected and they don’t separate into distinct maternal and paternal clusters. There’s just a big blob. So it could be really frustrating when you’re trying to do network analysis and you just get a big blob and there’s not distinct clusters to help you kind of figure out, okay, these people are from the maternal side, these people are from paternal, they’re just all kind of shared matches with everyone.
Nicole (26m 11s):
You can see some clusters like there’s one side cluster that’s all kind of, you know, off by itself, a green one that, but then you have like three clusters that are all really tightly connected in one big like round grouping. It can be difficult to work with network analysis and network graphs when you have pedigree collapse this close. If it’s further out pedigree collapse, then it’s not as difficult. But since this was her first great grandparents on the paternal and second great grandparents on the maternal side, it did cause quite a bit of overlapping clusters.
Diana (26m 46s):
So doing a network graph for pedigree collapse probably would be helpful to pull back on the, the amount of centor that you use, like maybe the 50 or 60, you know. Would that help to separate out those clusters a little bit, do you
Nicole (27m 3s):
Think? I don’t know. I would have to try that. That’s a really good idea to try different ranges and things and maybe that would help
Diana (27m 8s):
Since that made a difference with my multiple relationships or my ancestry. I’d be interesting to see how that works.
Nicole (27m 15s):
Yeah, I I thought you meant like going put the higher end at 50 and then going down to lower to see if that would help the clusters separate.
Diana (27m 24s):
I would just, I’d go the opposite direction, just use the larger matches and see you could explore it anyway. Well, let’s just do a couple takeaways and tips for pedigree collapse. So just remember that the effect will be noticeable for closer generat descendants of the collapse lines. And because those DNA segments are lost with each generation, the downstream matching won’t be as largely affected. If you do know that you have pedigree collapse in your family tree, carefully evaluate each DNA match that comes through those lines and just recognize it will be more difficult to cluster your matches. But using careful diagramming and good genealogy, you can tease out the relationships.
Diana (28m 6s):
So there’s still things you can do. Not all is lost. Well finally, let’s just do a little brief discussion of end domy. And as I mentioned before, pedigree collapse over many generations can result in end domy, but two to three instances do not. You need people reproducing within the same populations for hundreds of years. We’re thinking generations upon generations and that will become endy and it typically manifests in groups inter marrying for a cultural, religious, or geographic reason. So we typically see this in populations like the Ashkenazi Jewish Pacific Islanders, French Acadians, and the Amish.
Diana (28m 49s):
And what is the effect on genetic genealogy? Well, DNA matches will share many small segments making their total amount of shared DNA larger. So they appear to be a closer cousin when they’re actually distant and they just have many shared common ancestors far back in time. And as you might imagine, attempting to predict relationships becomes challenging because so many of the segments are inherited from that end agamous population.
Nicole (29m 18s):
Exactly. It can be really challenging and really discouraging, but learning some of the tips to help you deal with end domy can really help you gain that confidence that you can work with it again. And I’ve learned a lot about end Domy from Paul Woodbury and his excellent articles and his webinars at Legacy Family Tree webinars. So if you’re trying to work through it, I would really highly suggest that you go to those and we have them linked in our blog post that’s connected to this. But if you wanna look at network graphs and do a network analysis for agamous populations, what you’ll see is just a really big blob with like no clusters at all.
Nicole (29m 57s):
And so in our example, you can just see that there’s kind of a purple half and a green half with some orange dots in the middle, but it’s all just one big cluster. This was from an individual with Native American and Hispanic ancestry from New Mexico, and you can see that the two end agamous groups share DNA in many ways. This individual has over a hundred thousand DNA matches on ancestry, and 72,000 of them are distant, which means they’re sharing between six and 20 cent Morgans. There were so many shared match connections that it was difficult to download the matches and be in common with using the DNA Jcom client. So we had to just do a tiny range to even get anything to generate a network graph.
Nicole (30m 38s):
So we did a range of 68 to 90 centor because it just kept getting hung up and stopping because there were so many shared match connections. And so each shared match is a new row, and so with over thousands and thousands of rows, there’s like a limit of a million rows in a spreadsheet. So anyways, it was just getting hung up and so we just went with a smaller range and generated a network craft just to see what would happen. And as you can see with all the connecting lines, it appears that everyone shares with almost everyone else. And so as you can imagine, attempting to discover a common ancestor without distinct clusters is very difficult.
Nicole (31m 21s):
First, you would wanna look at your closer matches that are over 200 centor and look at the size of the segments. Longer segments are better. You’ll wanna focus on matches where the largest segment is at least larger than 20 centor, maybe 30 centor larger segments mean that you are likely related more recently than very far back. And then it helps to learn how each testing company deals with end domy because each company has its own strategy and their white papers can explain the science behind their algorithms. Several people have written blog posts and things that can help us with end domy. One of them is Roberta Estes. She wrote a blog post recently in her in search of series Signs of End Domy, and she discusses end domy and detail in many strategies for using ethnicity and segment data to help with it.
Nicole (32m 14s):
And then she also includes a summary of end domy tools at each DNA testing website. Be sure to check that out. And the other articles that we’ve listed as resources at the end of our blog post,
Diana (32m 25s):
It’s great that we’re getting a lot of resources to help us because we need all the help we can get when we’re talking about endy. So just some takeaways and tips for end domy. Remember that pedigree collapse can turn into endy and it can be difficult to know where one ends and the other begins, but with Endo, you really can’t cluster matches and you might be dealing with inflated amounts of shared DNA that don’t reflect the correct relationship, which is not always the case. You could have many, many matches. So work with the best matches, just like you said, Nicole, those sharing more DNA with larger segments and then also consider testing other relatives to try to find good matches.
Diana (33m 8s):
Also, consider why DNA and mitochondrial testing for relatives that can help you at least sort out various family lines. And then you’ll have to build trees for the best matches. So hopefully this has given you some insight into your own match list or the match list of someone that you’re working with that you perhaps thought was inmy or pedigree collapse or multiple relationships. Hopefully you can try to determine what you’re dealing with and you have some clues about what to do with it.
Nicole (33m 40s):
All right, thanks everyone for listening and we will talk to you again next week. Bye
Diana (33m 45s):
Bye-Bye everyone.
Nicole (34m 24s):
Thank you for listening. We hope that something you heard today will help you make progress in your research. If you want to learn more, purchase our books, Research Like a Pro and Research Like a Pro with DNA on Amazon.com and other booksellers. You can also register for our online courses or study groups of the same names. Learn more at FamilyLocket.com/services. To share your progress and ask questions, join our private Facebook group by sending us your book receipt or joining our courses to get updates in your email inbox each Monday, subscribe to our newsletter at FamilyLocket.com/newsletter. Please subscribe, rate and review our podcast. We read each review and are so thankful for them. We hope you’ll start now to Research Like a Pro.
Links
Endogamy, Pedigree Collapse, and Multiple Relationships: What’s the Difference and Why Does it Matter? – https://familylocket.com/endogamy-pedigree-collapse-and-multiple-relationships-whats-the-difference-and-why-does-it-matter/
DNA: In search of. . . Signs of Endogamy” – https://dna-explained.com/2022/08/11/dna-in-search-ofsigns-of-endogamy/
Diamond, Lara. “Chromosome Mapping and Endogamy.” DNA Painter Blog. https://blog.dnapainter.com/blog/chromosome-mapping-and-endogamy/. Posted 30 January 2022.
Ekins, Jayne. “Pedigree Collapse and Your DNA Matches.” Your DNA Guide. https://www.yourdnaguide.com/ydgblog/pedigree-collapse-and-genetic-relationships.
Estes, Robert. “Concepts – The Faces of Endogamy.” DNA eXplained – Genetic Genealogy. https://dna-explained.com/2017/03/10/concepts-the-faces-of-endogamy/. Posted 10 March 2017.
Estes, Roberta. “DNA: In Search of. . . Signs of Endogamy.” DNA eXplained – Genetic Genealogy. https://dna-explained.com/2022/08/11/dna-in-search-ofsigns-of-endogamy/. Posted 11 August 2022.
Estes, Robert. “What’s the Difference Between Pedigree Collapse and Endogamy?” DNA eXplained – Genetic Genealogy. https://dna-explained.com/2021/07/23/whats-the-difference-between-pedigree-collapse-and-endogamy/. Posted 23 July 2021.
International Society of Genetic Genealogy Wiki. “Endogamy. Latest update 10 July 2021.
Larkin, Leah. “The Endogamy Files: What is Endogamy?” The DNA Geek. https://thednageek.com/the-endogamy-files-what-is-endogamy/. Posted 5 May 2020.
Powell, Kimberly. “The Challenge of Endogamy and Pedigree Collapse.” Advanced Genetic Genealogy: Techniques and Case Studies. Editor, Debbie Parker Wayne. Iron Gate Publishing, 2019.
Woodbury, Paul. Dealing with Endogamy, Part 1: Exploring Amounts of Shared DNA.” LegacyTree Genealogists. https://www.legacytree.com/blog/dealing-endogamy-part-exploring-amounts-shared-dna. Posted November 2016.
Woodbury, Paul. Dealing with Endogamy, Part 2: Test Multiple Relatives.” LegacyTree Genealogists. https://www.legacytree.com/blog/dealing-endogamy-part-ii-test-multiple-relatives. Posted November 2016.
Research Like a Pro Resources
Research Like a Pro: A Genealogist’s Guide book by Diana Elder with Nicole Dyer on Amazon.com – https://amzn.to/2x0ku3d
Research Like a Pro eCourse – independent study course – https://familylocket.com/product/research-like-a-pro-e-course/
RLP Study Group – upcoming group and email notification list – https://familylocket.com/services/research-like-a-pro-study-group/
Research Like a Pro with DNA Resources
Research Like a Pro with DNA: A Genealogist’s Guide to Finding and Confirming Ancestors with DNA Evidence book by Diana Elder, Nicole Dyer, and Robin Wirthlin – https://amzn.to/3gn0hKx


Leave a Reply
Thanks for the note!