
When researching the identity of an ancestor who may have changed his name, examining the people he associated with can lead to important connections. In part 1 of this series, we looked at using the FAN methodology (comparing Friends, Associates, and Neighbors). The timeline clearly showed that Patrick Alford changed his name to James William Johnson between 1879 and 1885 to hide from Texas law. In part 2, we added confirmation of the relationship between James and his Alford siblings through documentary research. Could DNA evidence add the final proof to this case of a changed identity?
With documentary evidence confirming James William Johnson was born Patrick Alford, I wanted to see what the DNA evidence could reveal. If Patrick’s parents, Robert and Alcy, were married in 1849 and remained with the same children from 1860 through 1880, then they almost certainly were a biological family unit. In part three, I’ll cover Y-DNA and Autosomal DNA analysis in comparing DNA from Johnson descendants with Alford descendants to test my theory and prove James’s true identity. For privacy, I anonymized DNA match names in this article and in the linked report at the bottom of the page.
DNA Analysis
James William Johnson’s great-grandson with the same name–James William Johnson II–descended through James and Sara’s son, Charles Parker Johnson. James II had his Y-DNA tested at FamilyTreeDNA (FTDNA) and his Autosomal DNA tested at AncestryDNA.
A father only shares Y-DNA with his sons. Y-DNA changes very little and can be useful in tracing distant relationships along the paternal line. I used Y-DNA to test the hypothesis that James William Johnson was born Patrick Alford.
A father and a mother both share half of their Autosomal DNA (atDNA) with each child. This type of DNA can be useful in determining more recent relationships along both the paternal and maternal ancestral lines. I used atDNA results to support the now-documented family relationships.
Y-DNA
Y-DNA can link different surnames together and help sort out family relationships. Since Y-DNA can only pass from a father to his son, tracing the direct male line provides biological evidence to compare with documentary evidence. In modern-day America, surnames are passed down from a father, who got that surname from his father, and so on. What happens if the father decides to change his surname?
I reasoned that a father could decide to change the documentation, but the DNA will remain the same. In the case of James William Johnson, the Y-DNA carried by his descendants agreed with this logic. I noticed that no Y-DNA match carried the Johnson surname; this validated a break in the paper trail. The lack of evidence also disproved the possibility that Patrick’s mother, Alcy, married or had a misattributed paternal event with a Johnson male. In contrast, I observed many Y-DNA matches carrying the Alford surname, providing the biological evidence to prove reliability in the DNA.
Y-DNA Matches
Closely related Y-DNA matches are part of the same haplogroup. Haplogroup is the “name given to a large branch of the genetic human tree.”1 James II’s haplogroup, R-M269, is very common, but it does point to an Alford connection. The ideal Y-DNA match compares the same number of markers within a relatively close time frame to track down a common ancestor. Using 67 markers and a genetic distance within three steps can locate an ancestor within four to eight generations. This fits inside the genealogical time frame to test the hypothesis of a biological relationship between the contemporary Johnsons and the distant Alfords.
The results of a 67-marker comparison for test taker James William Johnson II at FamilyTree DNA (FTDNA) revealed the following:
- Twenty-seven Y-DNA matches shared the Alford surname
- Twenty-two were within a genetic distance of one to three steps
- Eighteen were in haplogroup R-M269.
- Zero matches had the Johnson surname.
Four matches stood out:
- Anonymous A
- Anonymous B
- Anonymous C
- Anonymous D
Y-DNA match Anonymous A’s earliest known ancestor was Charles Alford, born in 1790 and died in 1858. This fell within the range of four to eight generations from James William Johnson II and lines up with documentary evidence. The diagram below illustrates the documented paternal lines of the test taker, James II, and the Y-DNA match, Anonymous A, to Charles Alford (see Figure 3-1).
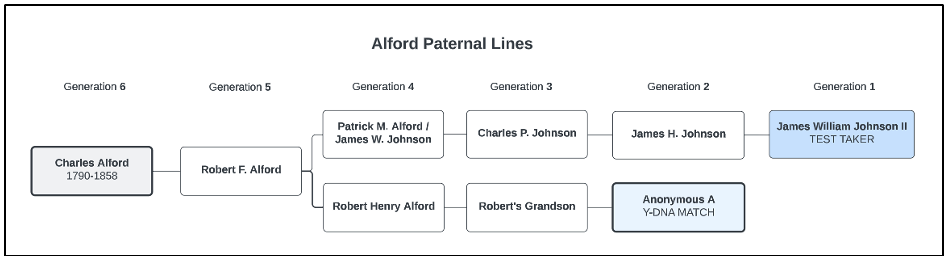
Figure 3-1. Alford Y-DNA Line
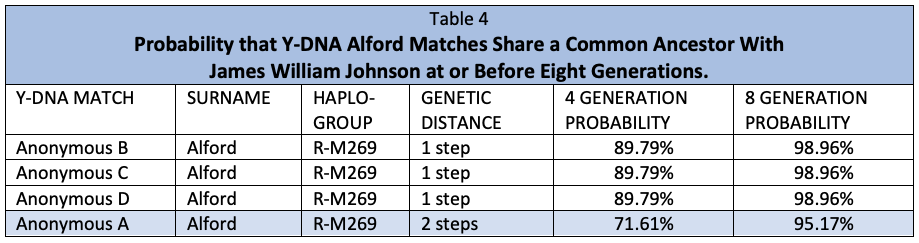
I noticed the other three Y-DNA matches shared the same surname, were in the same haplogroup, and had the same genetic distance. This was a good sign. The FTDNA TiP (TIme Predictor) Report showed a probability that James shared a relatively close common ancestor with them. In a table, I compared three matches, Anonymous B, Anonymous C, and Anonymous D, with Anonymous A (shaded in light blue). The higher probability at or before four generations could mean that Anonymous B, C, and D share a recent common ancestor around the Patrick Alford/James Johnson time frame.
Autosomal DNA
Everyone inherits exactly 50% of each parent’s atDNA. Beyond that, approximately 25% from grandparents, 12.5% from grandparents, 6.25% from great-great-grandparents, and about 3.12% from a third great-grandparent. DNA inheritance is a random process; everyone inherits different amounts of DNA from different ancestors. For example, second cousins will always share DNA, but the amounts will vary. Third and fourth cousins will not always share DNA, even though they are genealogically related. A relationship is measured in units called centimorgans (cM). A testing company applies probability to the total number of shared cM to predict how the test taker is related to a DNA match.2 Their relatedness correlates with average and range. In practice, when we look at the number of cM a DNA match shares, we expect that number to fall within a pre-determined range based on the known or theoretical relationship. When the number of cM falls within the expected range, this is a good sign that the DNA match is relevant, and we can safely proceed with our research. I like to use the Shared cM Project Tool at DNA Painter for this step.3
In Figure 3-2, I listed several relationships, their average cM shared, and pre-determined cM ranges with which to compare relevant DNA matches for the Johnson project. Notice that a second cousin (2c) match usually shares an average of 229 cM, but the amount of DNA can range anywhere from 41 to 353 cM. To illustrate this in practice, look at the red bold letters in Table 5 below. James 3, a predicted 2C match, shares 169 cM with James II. 169 cM falls within the 41-353 cM range, so this is a good sign that James 3 is a relevant match and I can safely proceed with my research. If you’re new to DNA, you might have a headache like I did at first, and that’s okay. This is challenging subject matter. The next section is even more of a challenge to grasp. Just keep swimming or skip to the conclusion and come back when that headache goes away!
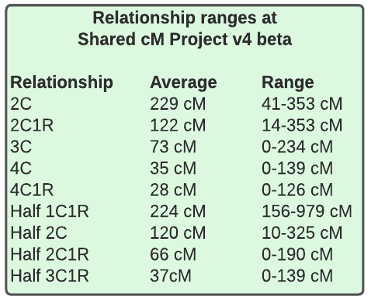
Figure 3-2. Relationship Ranges Using the Shared cM Project Tool.
Checking that cM shared are within the predicted cM range is a fundamental DNA concept that easily becomes overwhelming when managing and comparing a large number of DNA matches from multiple family lines. To simplify complex information, I organized nineteen matches in a table and color-grouped them by Most Recent Common Ancestor (MRCA). I anonymized names according to the sibling lines of each MRCA couple; there are five couples.
Ancestry ThruLines© uses self-reported tree information to identify the MRCA couple. I used Ancestry ThruLines© to gather DNA matches that descended through each MRCA couple represented in this study. I then selected one match from each sibling line who shared the highest amount of DNA with my client, James II. I created a table to keep track of the details: Johnson-Anderson matches are color-grouped in white; Johnson-Clark in gray, Alford-Evans in blue, Alford-Tipton in green; and Evans-Parks in yellow. The finished product is extremely information-dense. For readers new to DNA, focus on columns labeled “cM SHARED” and “cM RANGE” and proceed with patience.
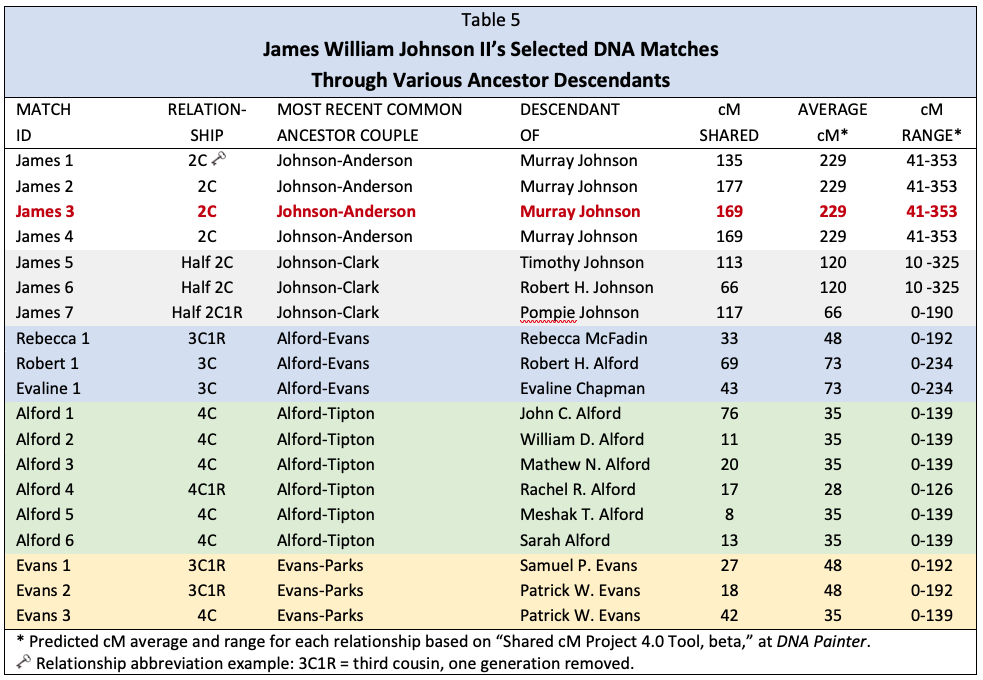
Having the details available in Table 5 helps to quickly verify that each match shared amounts of DNA within the predicted range. Using the list in Table 5, I created diagrams showing how each match was related to James II. This helped me visualize the relationship so that I could accurately check and compare shared amounts of DNA.4
The Johnson/Anderson Family
Four matches were selected who descend from James William Johnson and his first wife, Sarah Jane Anderson. These matches share an amount of DNA within the predicted range of second cousins (see the white section of Table 5). The diagram below shows each match and the amount of DNA shared with the test-taker, James William Johnson II.
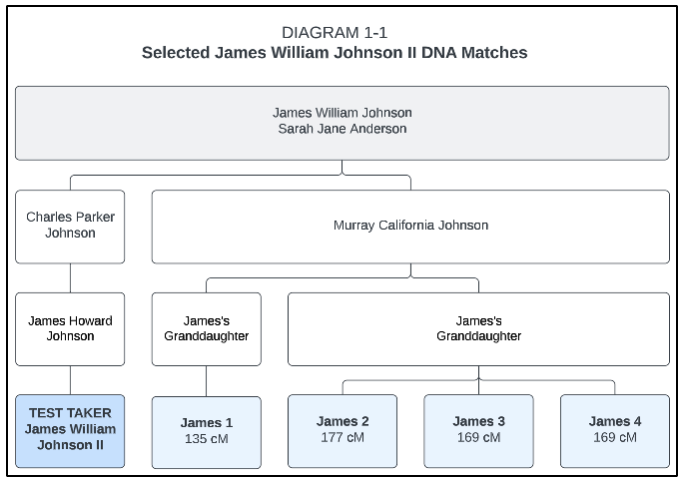
Figure 3-3. James William Johnson II DNA Matches Through Johnson–Anderson Descendants.
The Johnson/Clark Family
Three matches were selected who descend from James William Johnson and his second wife, Dempsey Tennessee Clark. Because these matches descend through a different wife, genetic genealogy defines this type of relationship as a half relationship to James II. Predicted half relationships will share smaller amounts of DNA than predicted full relationships because the shared DNA comes from one ancestor instead of two. These three matches share an amount of DNA within the predicted range of half-cousins (see the gray section of Table 5). The diagram below shows each match and the amount of DNA shared with the test-taker, James William Johnson II.
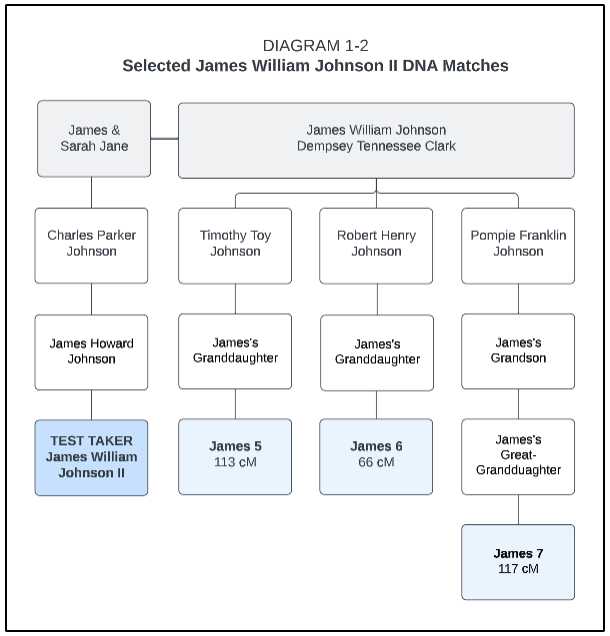
Figure 3-4. James William Johnson II DNA Matches Through Johnson–Clark Descendants.
The Alford/Evans Family
Three matches were selected who descend from Robert F. Alford and his wife, Alcy Evans. These matches share an amount of DNA within the predicted range of third cousins (see the blue section of Table 5). The diagram below shows each match and the amount of DNA shared with the test-taker, James William Johnson II.
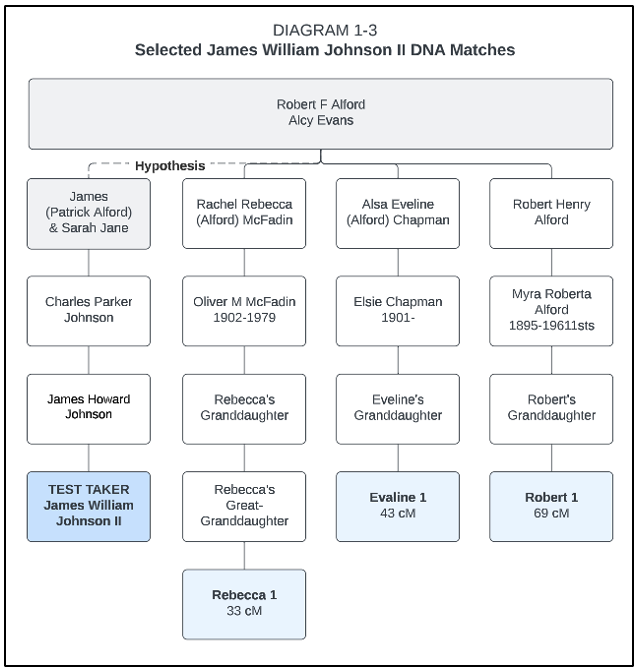
Figure 3-5. James William Johnson II DNA Matches Through Alford–Evans Descendant.
Combined Johnson/Alford Families
When diagrams 1-1, 1-2, and 1-3 are combined, the results show how atDNA supports the hypothesized relationship between James and the Alford parents. The diagram below shows the combined Johnson/Alford matches in blue and the Alford–Evans descendant matches in light blue.
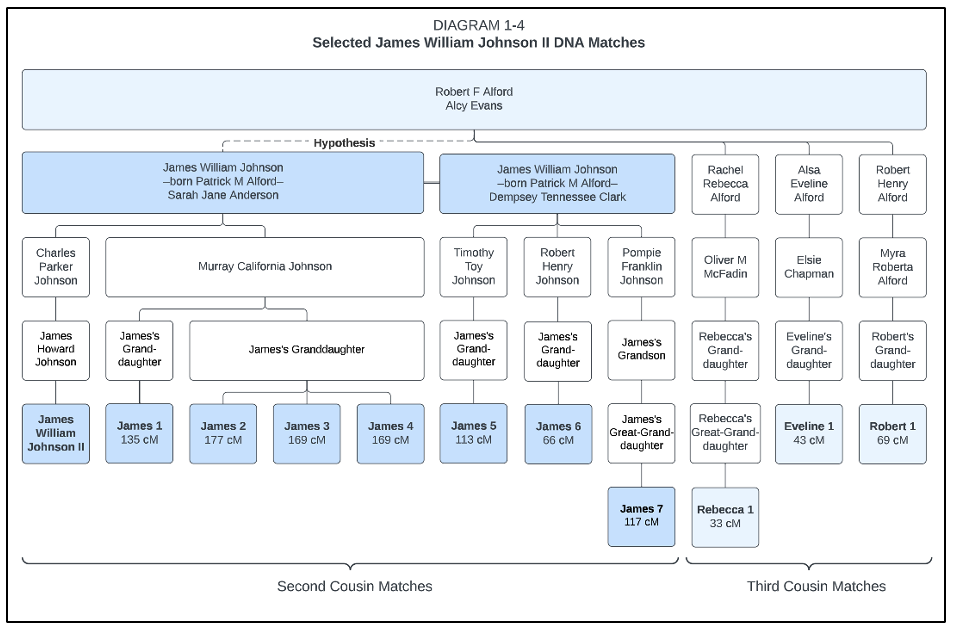
Figure 3-6. James William Johnson II DNA Matches through Robert F. Alford and Alcy Evans.
Shared Matches
A shared match on AncestryDNA “is someone who appears both on your list of matches and on someone else’s.”5
For example, James II and his second cousin, James 5, both have James II’s third cousin, Robert 1, on their list of matches; Robert 1 is a shared match (see Table 6). James II’s second cousins from Figure 3-6 are listed in Table 6, shaded in blue. James II’s third cousins from Figure 3-6 are also shown in Table 6, shaded in gray. All shared matches are marked with an “x” in white.
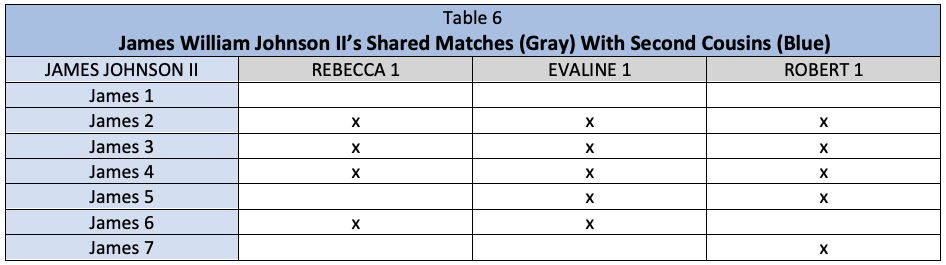
The shared matches in Table 6 form a genetic network or cluster. Using this genetic cluster with documented parent–child links can lead to solid conclusions: “If several members of a genetic network group all descend from a known ancestor or ancestral couple, then it can be assumed that the other members of that group are also likely related through the same ancestral line.”6[4]
In James II’s case, the DNA matches forming the genetic cluster in Table 6 all likely descend from Robert Alford and Alcy Evans. Although each parent–child link needs to be verified with documentary research, these matches support a biological relationship between the Johnsons and Alfords. Documenting these links can be done in future research.
Alford-Tipton Matches
Ancestry’s ThruLines© tool uses their online public member trees to suggest genealogical relationships to DNA matches. The results are only as accurate as the member’s trees. Thirty–two DNA matches were suggested to have descended through Charles Alford and his wife, Elizabeth Tipton. Six matches–one from each Alford sibling–are named in Table 5 (shaded green). These matches share an amount of DNA within the predicted range of fourth cousins. Although each parent–child link needs to be verified with documentary research, this shows strong evidence of a biological relationship between the Johnsons and Alfords.
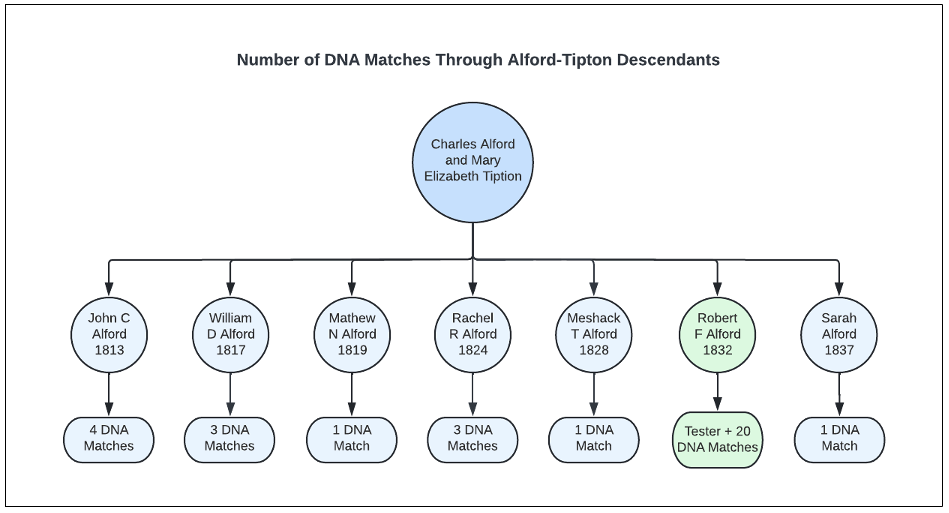
Figure 3-7. Number of James William Johnson II’s DNA Matches Through Alford–Tipton Descendants.
Evans-Parks Matches
Twenty-three DNA matches were suggested to have descended through Patrick Henry Evans and his wife, Rebecca Parks. Three Evans sibling matches are named in Table 5 (shaded yellow). These matches also share an amount of DNA within the predicted range of fourth cousins. Although each parent–child link needs to be verified with documentary research, this shows strong evidence of a biological relationship between the Johnsons and Evans.
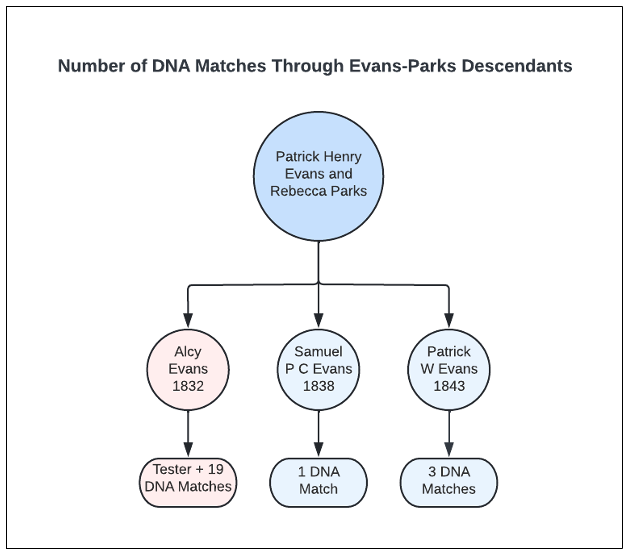
Figure 3-8. Number of James William Johnson’s DNA Matches Through Evans–Parks Descendants.
After a thorough examination of Autosomal DNA, I concluded that DNA matches at the second, third, and fourth cousin levels provided strong and sufficient evidence for a biological relationship between the James William Johnson descendants and the Robert and Alcy Alford descendants.
Conclusion
I ended with this written conclusion: This research session successfully confirmed that James William Johnson was born Patrick M. Alford. The evidence contained in the paper clues of James and Patrick’s FAN club, together with DNA analysis, prove the biological connection between the Johnsons and the Alfords. The timeline of events in various records compared with their locations showed probability. These events viewed through the lenses of historical and societal context indicated why. The geographical consideration of rivers, farmland, and forests, incorporated with available travel and communication, shed light on how.
Tips for FAN club research
- Begin with an open mind (reason and logic)
- Consider name variations and patterns (shortened given names; middle names; nicknames, re-naming of loved ones)
- Observe who and what is missing (Negative evidence- No Patrick after 1879; No James before 1879; Elsie Jane missing in 1900 census; Johnson surname missing from Y-DNA results)
To read the full research report, see below:
ANONYMIZED James William Johnson Project
Sources
- Blaine T. Bettinger and Debbie Parker Wayne, Genetic Genealogy in Practice (Arlington, Virginia: National Genealogical Society, 2016), 143. Haplogroup is “a name given to a large branch of the genetic human tree; there are separate genetic trees for Y-DNA and for mtDNA; two individuals must have the same haplogroup to be closely related on the Y-DNA or mtDNA line.”
- Diahan Southard, Your DNA Guide The Book (United States of America: www.yourDNAguide.com, 2020], 103.
- Jonny Perl and Blaine Bettinger, “The Shared cM Project 4.0 tool v4,” DNA Painter (https://dnapainter.com/tools/sharedcmv4 : accessed 25 August 2022).
- Diana Elder, Nicole Dyer, and Robin Wirthlin, Research Like a Pro with DNA (Highland: Family Locket Books, 2021), 30-37.
- “AncestryDNA Shared Matches,” AncestryDNA (https://support.ancestry.com/s/article/AncestryDNA-Shared-Matches?language=en_US : accessed 13 September 2022).
- Paul Woodbury, “Connecting the Dots–Introduction to Auto Clusters at MyHeritage DNA,” webinar and syllabus, Legacy Family Tree Webinars (https://www.familytreewebinars.com : posted 14 July 2020).


2 Comments
Leave your reply.