When using DNA test results as evidence in genealogy, it’s important to understand contextual information about DNA inheritance patterns and amounts of DNA shared between relatives. This contextual information can turn raw DNA data into genealogical evidence. In this post I will share several charts that give meaning to the data in our DNA test results. The charts I’m sharing are freely available online. Another excellent source for inheritance charts is the book Genetic Genealogy in Practice by Blaine T. Bettinger and Debbie Parker Wayne. The charts in the book are well done and helpful for understanding the inheritance of autosomal DNA, mitochondrial DNA, and the X and Y-chromosomes.
mtDNA and Y-DNA Inheritance
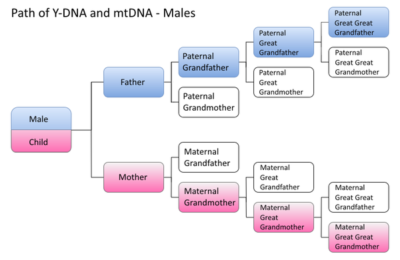 Mitochondrial DNA is inherited by both males and females but is only passed on by females. Y-DNA is inherited and passed along only by males. To view a chart showing the path of Y-DNA and mtDNA transmission, go to the following ISOGG Wiki article: “Mitochondrial DNA tests,” The International Society of Genetic Genealogy Wiki (https://isogg.org/wiki/Mitochondrial_DNA_tests : last modified 28 January 2019, at 17:08).
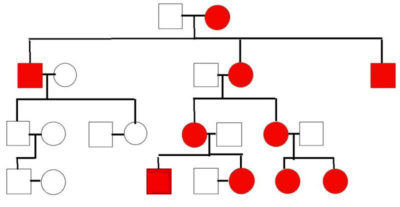 This mtDNA inheritance chart by Debbie Parker Wayne shows how mtDNA is inherited. View the chart here: Debbie Parker Wayne, “Maternal Lines: Using Mitochondrial DNA (mtDNA),” Debbie Parker Wayne (http://debbiewayne.com/presentations/mtdna.php : accessed 13 August 2019).
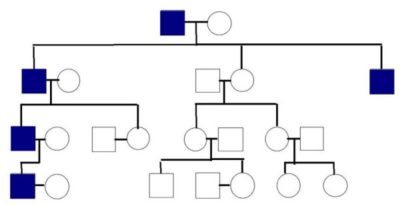 This Y-DNA inheritance chart by Debbie Parker Wayne also uses squares for men and circles for women. Blue represents those with Y-DNA inherited from the male at the top of the chart. View the full-sized chart here: Debbie Parker Wayne, “Y-DNA Inheritance,” Debbie Parker Wayne (http://debbiewayne.com/presentations/ydna.php : accessed 13 August 2019).
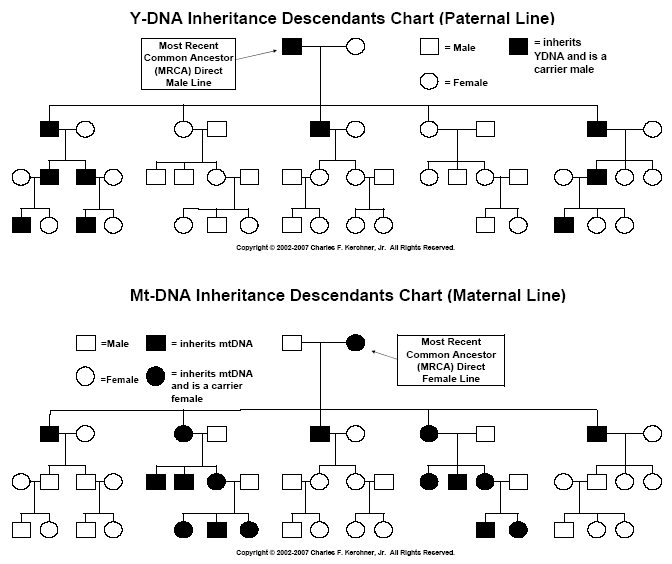
Charles F. Kerchner has shared a helpful Y-DNA and mtDNA Inheritance Descendants Chart showing which descendants inherit Y-DNA and mt-DNA from a single common ancestor. You can view the chart here: Charles F. Kerchner, Jr. “Y-DNA and mtDNA Inheritance Descendants Charts,” 7 October 2007, Kerchner’s DNA Testing & Genetic Genealogy Info and Resources Page (http://www.kerchner.com/y&mtdnachart.htm : accessed 13 August 2019).
Autosomal DNA Inheritance
Several helpful diagrams and charts give meaning and context to your autosomal DNA test results. I’ve highlighted them below.
Average Percentages of Shared DNA
The following chart shows the average amount (in percentages) of autosomal DNA that is shared by close relatives. To read the chart, locate the orange box that says “self.” If you have taken an autosomal DNA test, you can expect to share about 50% of your DNA with your father/mother, brother/sister, and son/daughter. You can expect to share about 25% of your DNA with your granddaughter/son, grandfather/grandmother, uncle/aunt, and niece/nephew. This chart can help you understand the approximate amount of DNA inherited in each generation. It also helps visualize the concept of cousins and cousins removed, which is key when we’re working with autosomal DNA matches. To view the source of the chart go here: Dimario, “Cousin Tree (with genetic kinship),” Wikimedia Commons (https://commons.wikimedia.org/wiki/File:Cousin_tree_(with_genetic_kinship).png : last updated 27 April 2010).
.png)
Cousin tree with genetic kinship illustrating genetic degree of relationship with ‘self’ in percentage (%)
Genetic Family Tree vs. Genealogical Family Tree
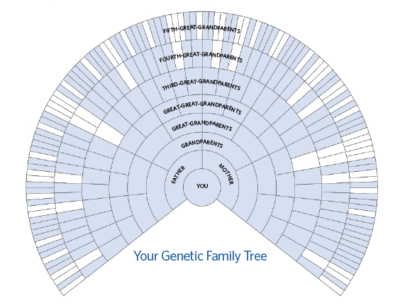 An important concept to understand when interpreting autosomal DNA results is one popularized by Blaine Bettinger – the difference between a genetic family tree and a genealogy family tree. In his article, “DNA Solutions: Genealogical vs. Genetic Family Trees,” at Family Tree Magazine, he states, “With each generation, you inherit less DNA from an ancestor until at a certain point—approximately seven generations—you receive DNA from only some of the ancestors in every generation.” That just means that you inherited DNA from all of your ancestors back to your great-great grandparents. Beyond that, you are not guaranteed to have inherited DNA from all of your ancestors. Every person’s genetic family tree might look a little different, depending on which 3-5th great grandparents they inherited DNA from. The chart Blaine uses to show this principle is helpful for visualizing this concept. You can view his charts at the articles linked below.
Blaine Bettinger, “DNA Solutions: Genealogical vs. Genetic Family Trees,” May 18, 2016, Family Tree Magazine (https://www.familytreemagazine.com/index.html%3Fp=7832.html : accessed 13 August 2019).
Blaine Bettinger, “Q&A: Everyone Has Two Family Trees – A Genealogical Tree and a Genetic Tree,” 10 November 2009, The Genetic Genealogist (https://thegeneticgenealogist.com/2009/11/10/qa-everyone-has-two-family-trees-a-genealogical-tree-and-a-genetic-tree/ : accessed 13 August 2019).
X-Chromosome Inheritance Charts
 X-DNA is tested as part of the autosomal DNA test. The X-chromosome is one of the sex chromosomes. Females have two X chromosomes (XX), one from each parent, and males have one X chromosome from their mother and one Y chromosome from their father (XY). The companies that provide X-match information include 23andMe and Family Tree DNA, but you can also find X matches by transferring your DNA results to GEDMatch.
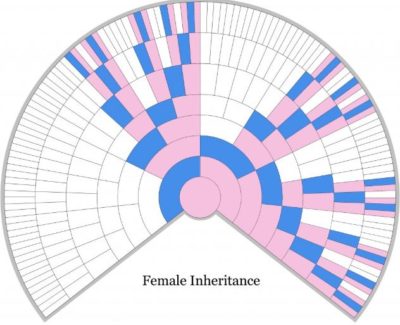
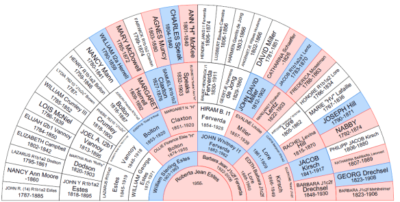
If you find that you are an X-match with someone, you can use the unique X inheritance pattern illustrated in the following charts to narrow the possible common ancestors. Blaine Bettinger created two X-DNA inheritance fan charts, one showing who a female may have inherited her X-DNA from, and one showing the same for a male. The pink ancestors are females who may have contributed X-DNA, and the blue ancestors are males who may have contributed X-DNA. View the charts here: Blaine Bettinger, “Unlocking the Genealogical Secrets of the X Chromosome,” 21 December 2008, The Genetic Genealogist (https://thegeneticgenealogist.com/2008/12/21/unlocking-the-genealogical-secrets-of-the-x-chromosome/ : accessed 13 August 2019).
 Blaine later created an X-chromosome inheritance chart showing contribution percentages. He also shared Rodney Jewett’s X-chromosome inheritance fan chart which includes the Ahnentafel numbers of contributing X-chromosome ancestors in his article here: Blaine Bettinger, “More X-Chromosome Charts,” 12 January 2009, The Genetic Genealogist (https://thegeneticgenealogist.com/2009/01/12/more-x-chromosome-charts/ : accessed 13 August 2019).
 Roberta Estes wrote an article about using Charting Companion software by Progeny Genealogy to create charts for genetic genealogy. The software is compatible with Ancestry, Ancestral Quest, Family Historian, Family Tree Maker, GEDCOM, Legacy Family Tree, PAF, and Roots Magic. In her article, she shares an example of the X-DNA chart that Charting Companion created. View her article here: Roberta Estes, “Using X and Mitochondrial DNA Charts by Charting Companion,” 7 February 2017, DNA eXplained (https://dna-explained.com/2017/02/07/using-x-and-mitochondrial-dna-charts-by-charting-companion/ : accessed 13 August 2019).
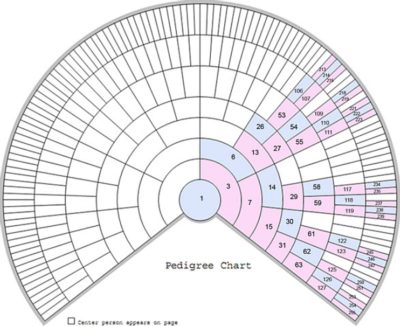
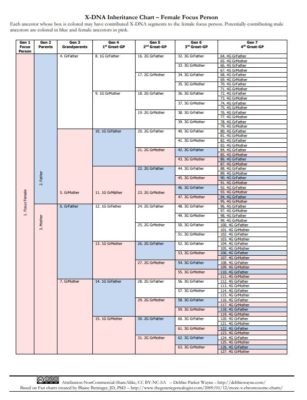
 You may want to visualize the X-DNA inheritance path with a pedigree chart naming the possible contributing ancestors and the range of X-DNA that may have been inherited from them. Jim Turner created several X-chromosome inheritance charts that do this. View the charts here: James C. Turner, “X Chromosome Inheritance,” RootsWeb Freepages (http://freepages.rootsweb.com/~hulseberg/genealogy/DNA/xinheritance.html : accessed 13 August 2019).
 Debbie Parker Wayne provides colorized pedigree charts based on Blaine Bettinger’s blue/pink X-DNA fan charts for analysis of X-DNA on her website in word doc, rich text, and PDF format. To view them, go here: Debbie Parker Wayne, “Quick Reference Links,” X-DNA section, Debbie Parker Wayne (http://debbiewayne.com/pubs.php#quickref : accessed 13 August 2019)
The Shared cM Project Tool
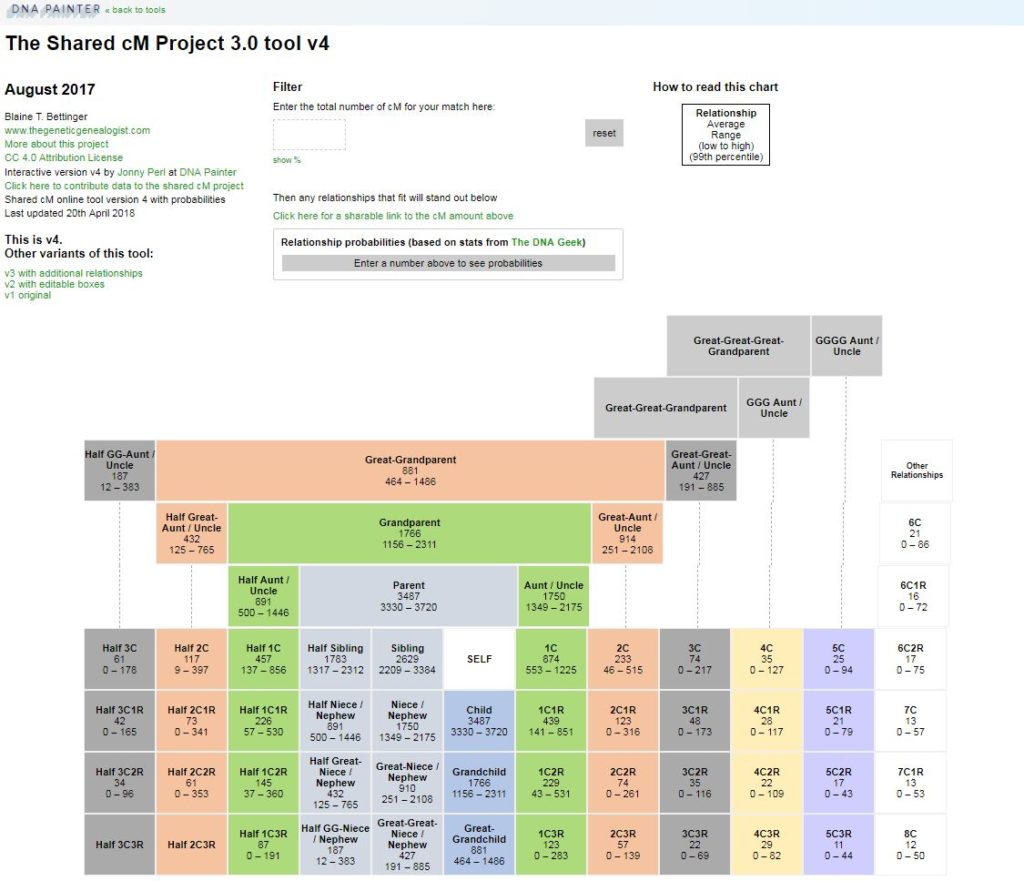 The Shared cM Project 3.0 tool v4 by Blaine T. Bettinger is a chart showing the centimorgan ranges for various relationships. The Shared cM Project 3.0 Tool v4 is an interactive version of the shared cM project. It was created by Jonny Perl and is available on his website, DNA Painter. The tool allows you to enter the total number of cM that you and a match share and then see a list of relationship probabilities based on stats from The DNA Geek (Leah Larkin, Ph.D.). To read more about the Shared cM Project and how it was created, read Blaine’s post here: Blaine Bettinger, “August 2017 Update to the Shared cM Project,” 26 August 2017, The Genetic Genealogist (https://thegeneticgenealogist.com/2017/08/26/august-2017-update-to-the-shared-cm-project/ : accessed 13 August 2019).
To use the Shared cM Project Tool, go here: Blaine Bettinger and Jonny Perl, “The Shared cM Project 3.0 tool v4,” DNA Painter (https://dnapainter.com/tools/sharedcmv4 : accessed 13 August 2019).
Autosomal DNA Statistics
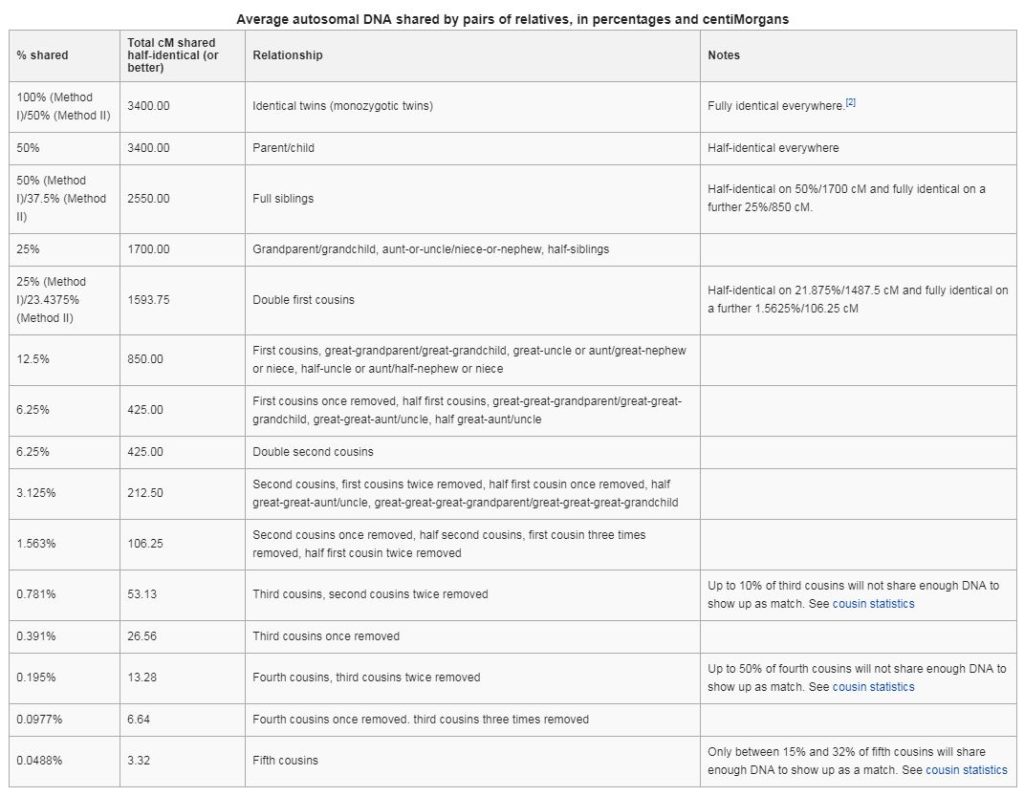 The International Society of Genetic Genealogy Wiki (ISOGG Wiki) article about autosomal DNA statistics contains a chart showing the average amount of autosomal DNA shared by pairs of relatives, in percentages and centimorgans. In this chart you can find the average amount of DNA various types of cousins share. For example, third cousins share an average of 0.781% of their DNA, or about 53.13 cM. The chart also states that up to 10% of third cousins will not share enough DNA to show up as a match. To view the autosomal DNA statistics chart, go here: “Autosomal DNA Statistics,” The International Society of Genetic Genealogy Wiki (https://isogg.org/wiki/Autosomal_DNA_statistics : last modified on 3 September 2018, at 21:29.)
Cousin Statistics
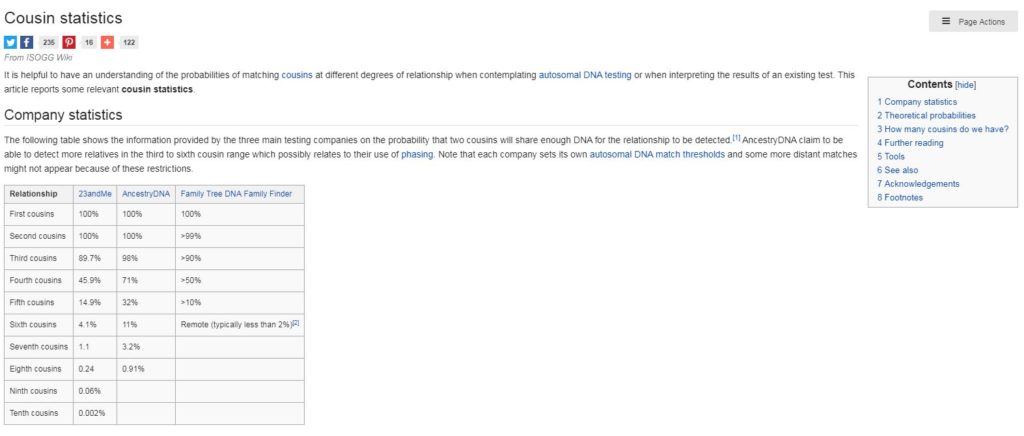
A chart contained in the article “Cousin Statistics” on the ISOGG Wiki details the probability that two cousins will share enough DNA for the relationship to be detected. Each testing company reports different probabilities. The chart includes data from 23andMe, AncestryDNA, and Family Tree DNA Family Finder. The article also includes charts with theoretical probabilities and estimates about the number of cousins we have. View the article and charts here: “Cousin Statistics,” The International Society of Genetic Genealogy Wiki (https://isogg.org/wiki/Cousin_statistics : last modified on 20 September 2017, at 13:21.)
To view my Pinterest board with these charts and others pinned, go here: DNA Inheritance Charts for Genetic Genealogy.
Other articles in the Research Like a Pro with DNA series:
Step 1 Take a DNA Test: Which DNA Test Should I Take? and DNA-Recommended Testing Strategy
Step 2 Assess: Understanding and Using Your DNA Results – 4 Simple Steps
Step 3 Organize: Seeing the Big Picture: 3 Ways to Chart Your DNA Matches
Step 4 Research Objective: What Do You Want to Know? 3 Steps to Focus Your DNA Research
Step 5 Analyze your Sources: DNA Sources, Information, and Evidence: Sorting it All Out
Step 6 Locality Research: Where in the World Has My DNA Traveled? DNA and Locality Research
Step 7 Research Planning: Genealogy Research Planning with DNA
Methodology and Tools to use as you plan your research:
– Charts for Understanding DNA Inheritance – You Are Here
– Clustering or Creating Genetic Networks
– Pedigree Triangulation
– Chromosome Browsers
– Segment Triangulation
– Chromosome Mapping
– DNA Gedcom
Step 8 Source Citations: DNA Source Citations
Step 9 Research Logs: DNA Research Logs: how to keep Track of Genetic Genealogy Searches
Step 10 Report Writing: DNA Research Reports – the Ultimate Finish
Step 11 What’s Next? Continue Your Research & Writing, Productivity, and Education
Save to Pinterest:


4 Comments
Leave your reply.