
In this second post in our series on Ancestry DNA , we’ll look at how to save, record, and analyze your own 2026 Ancestral Regions results, with my father, Ellis Guiles, as the example (Figure 1). Five steps take you from saving your results to recording what you find. If you tested before the update, you can also review your previous results. Ancestry changed its method (Part 1), so a changed percentage does not always mean something new about your family.[1] Comparing the two versions helps you separate update-related changes from changes that deserve a closer look. If you tested after the update, you can follow every step with your current results, which become your starting point for developing research objectives and research plans based on your Ancestral Regions.
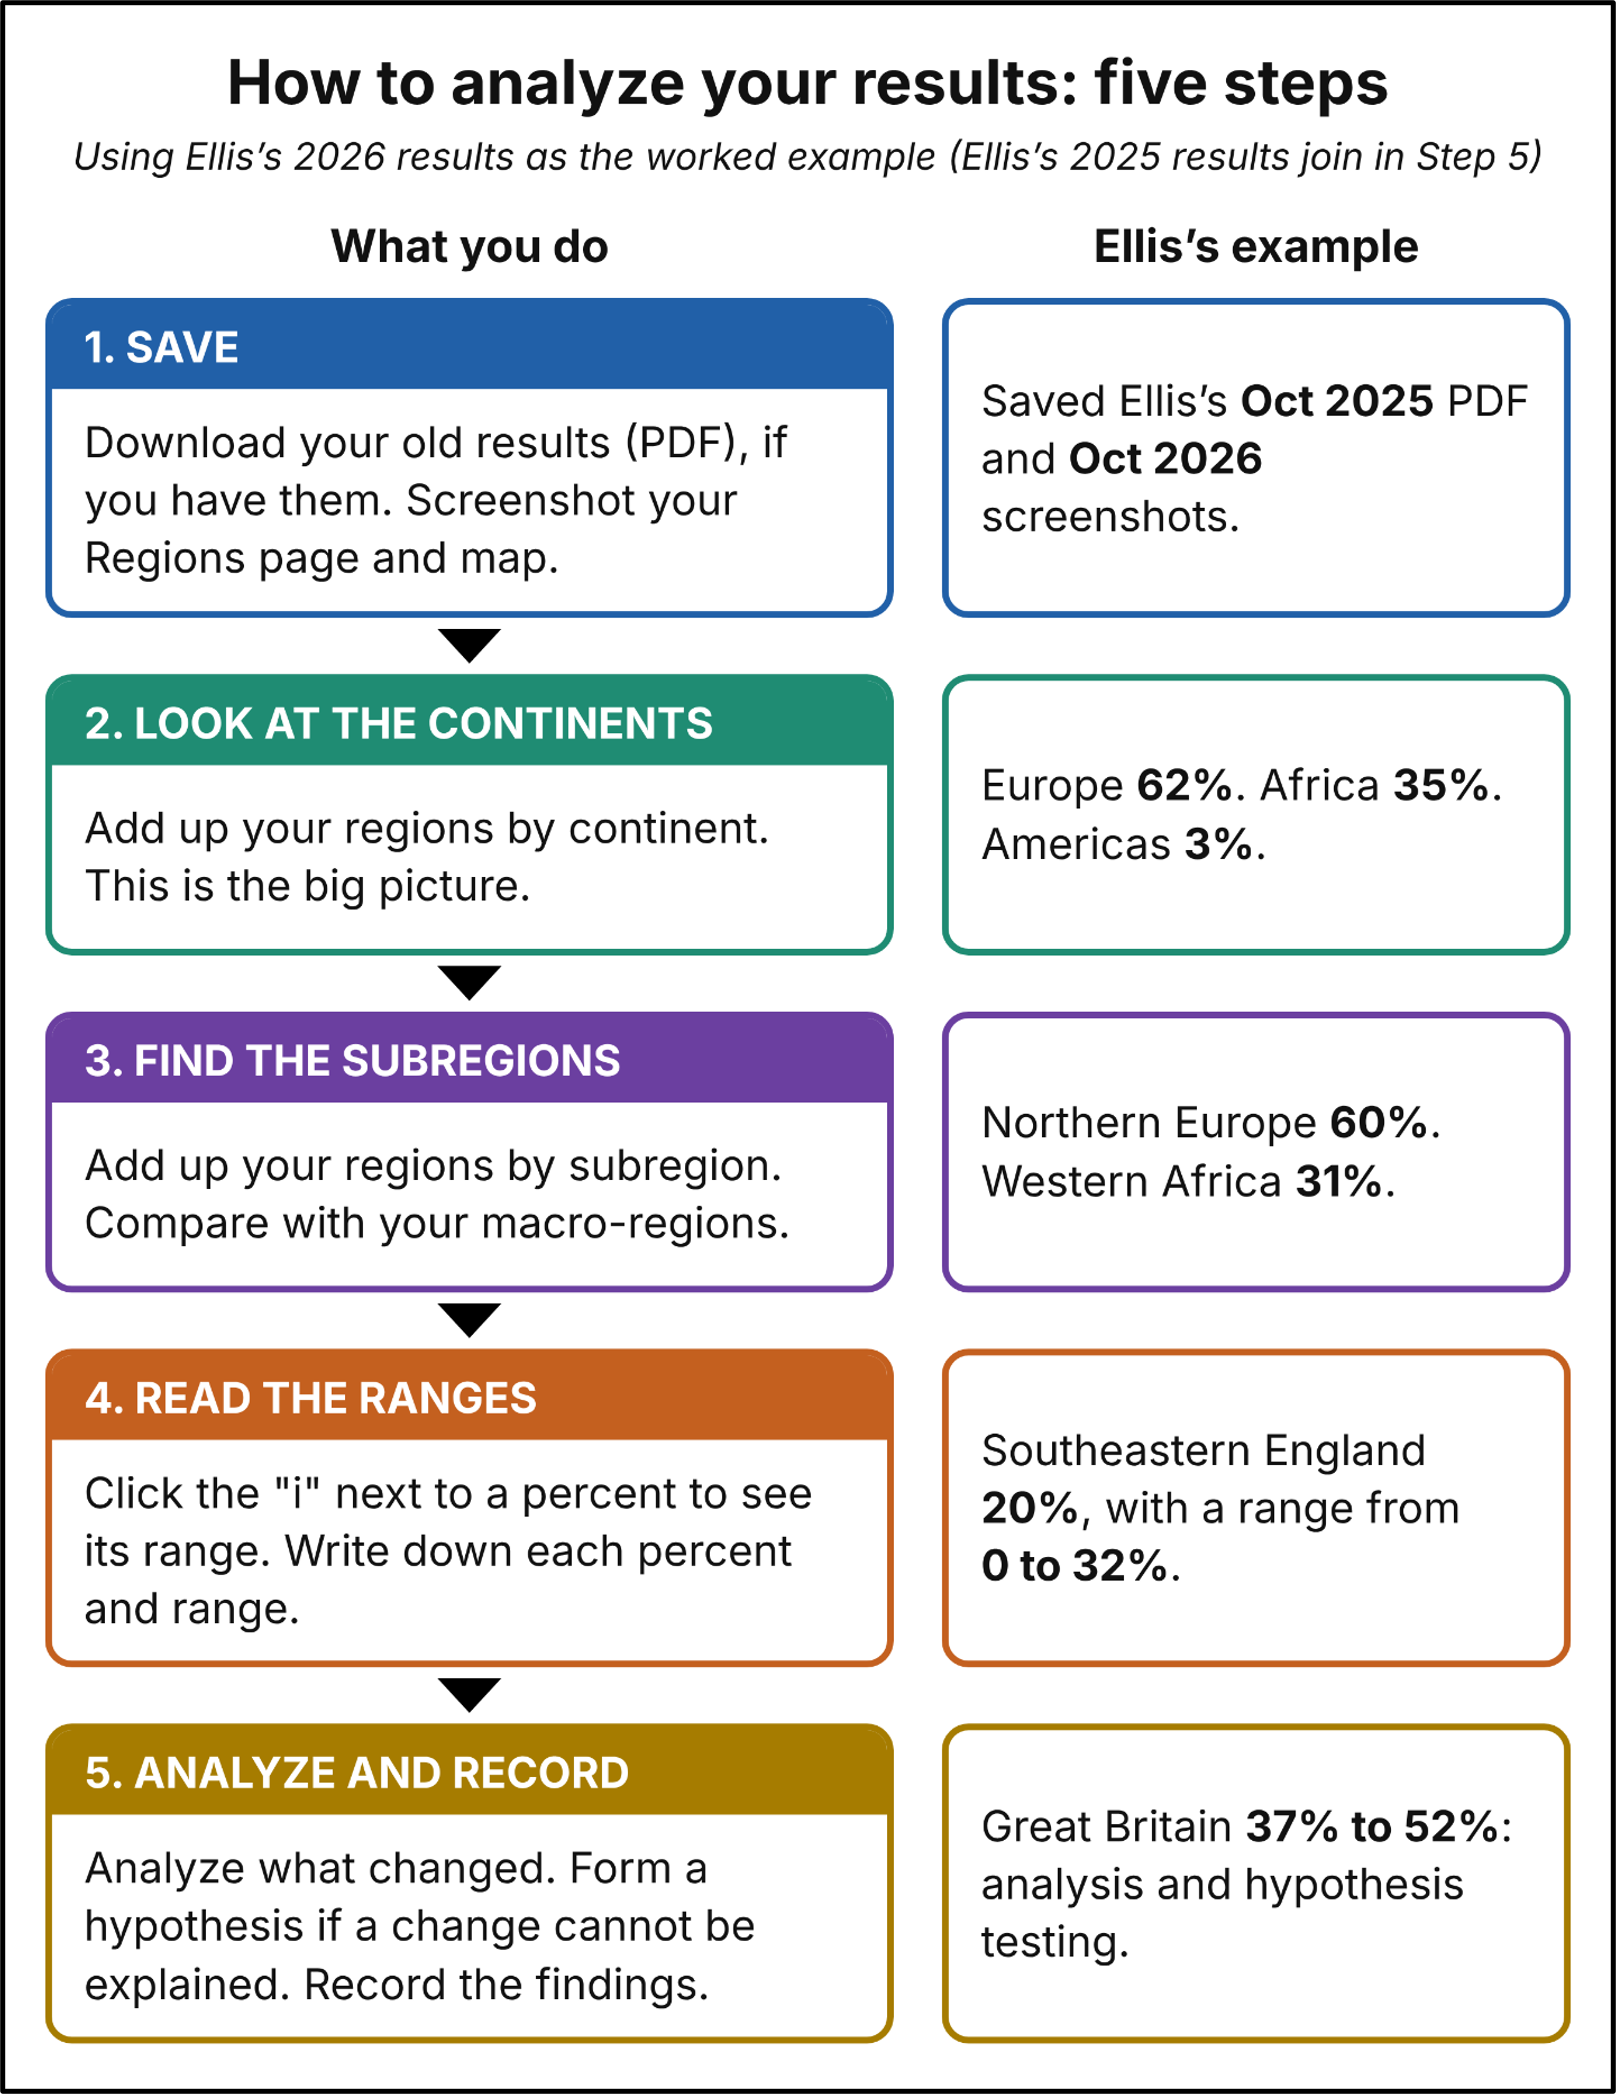
Figure 1. The five steps to analyze your Ancestral Regions, using my father, Ellis Guiles, as the example.
1. Save
Saving your Ancestry region results takes several steps. Save your previous results first, then your current results, because Ancestry removes previous regions after ninety days. Ancestry’s help article explains:[2]
“Updated regions are provided for free of charge to current AncestryDNA members. For 90 days after an update, you can download the prior version of your results…”
1. Click the DNA tab at the top of the page. On the Summary page (blue arrow), click Origins (red arrow; Figure 2).
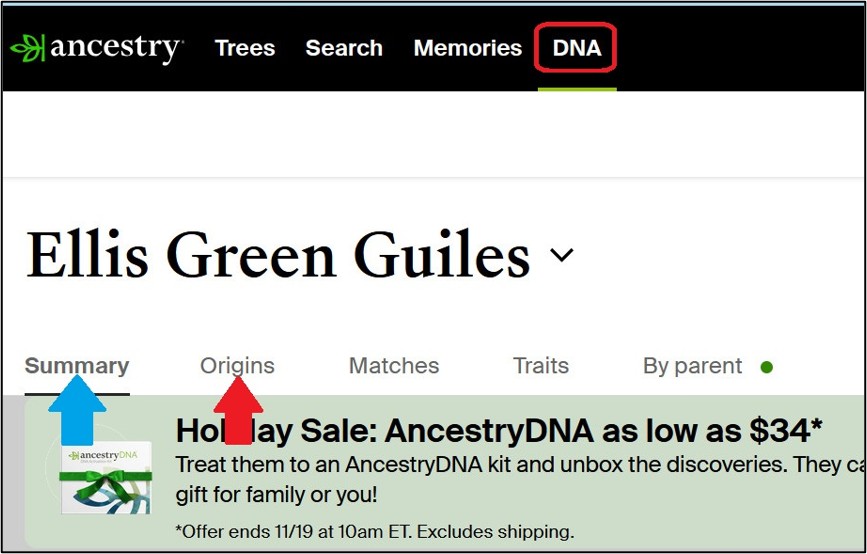
Figure 2. Select “Origins” (red arrow) from the “Summary” DNA page (blue arrow).
2. The Origins page has three choices: Regions, Journeys, and By Parent. Stay on Regions, which shows your Ancestral Regions (Figure 3).
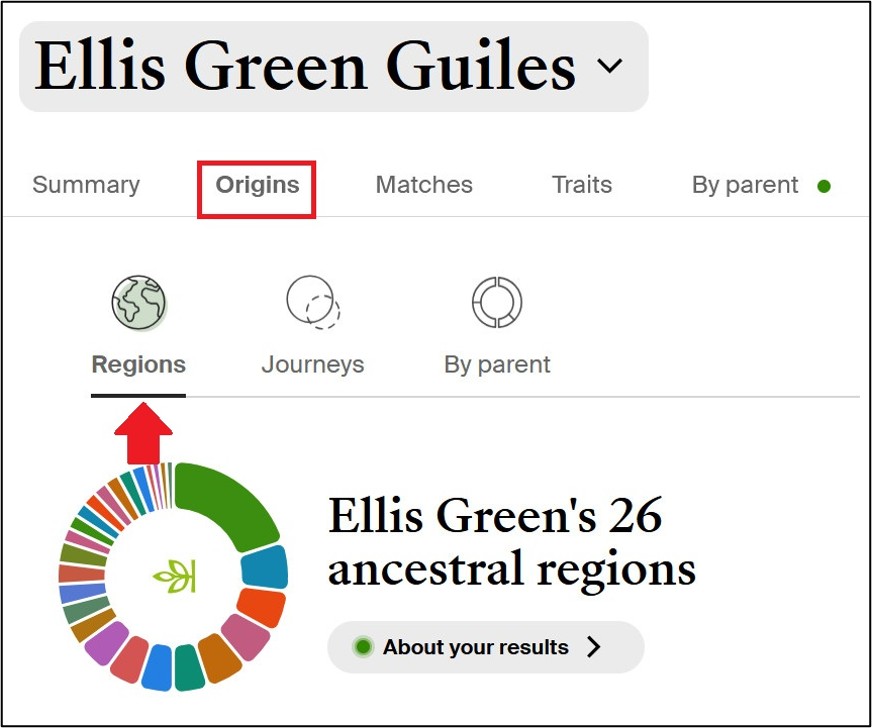
Figure 3. The “Regions” page, the first of the three choices on the “Origins” page.
3. Scroll to the bottom of your regions list. Below the last region, the date of your last update (blue arrow) appears beside a link, “View previous results and FAQs” (red arrow; Figure 4). Click the link.
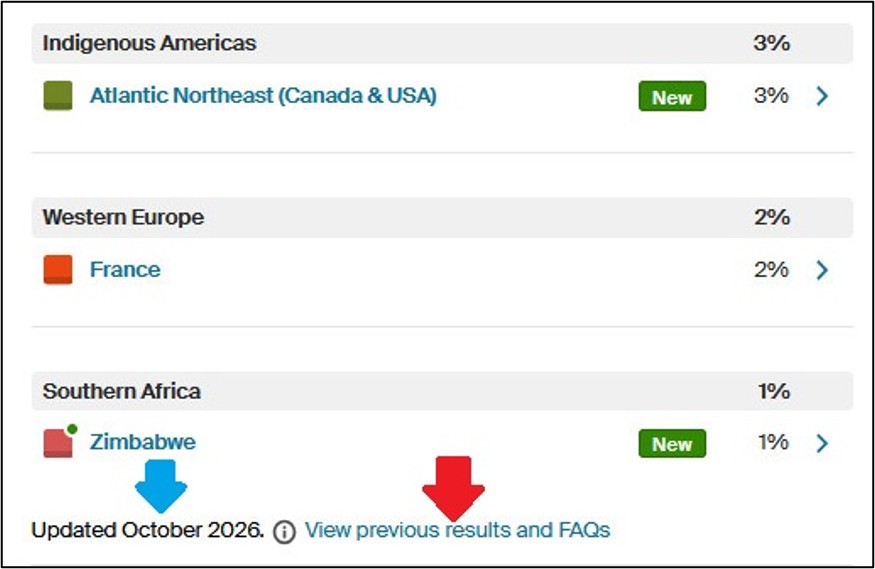
Figure 4. At the bottom of the list, find the date of the last update (blue arrow) and the “View previous results and FAQs” link (red arrow). Ellis’s results were last updated in October 2026.
4. The next page is called “What changed?” It lists each region, its percentage in the previous version, its percentage in the current version, and the difference between them. Ancestry may label the columns with dates or with the words Previous and Current (Figure 5). On 8 October 2026, Ellis’s columns read October 2025 and October 2026 (not shown). On 21 October 2026, they read Previous and Current (Figure 5).[3] Click the “Download PDF” button (red arrow; Figure 5) to save your previous results.”
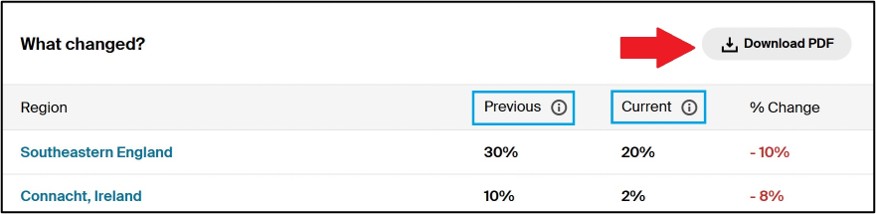
Figure 5. The top of the “What changed?” page when I saved Ellis’s results on 8 October 2026. The columns are labeled October 2025 and October 2026. On 21 October 2026, Ancestry labeled the same columns Previous and Current (blue boxes). This shows only a portion of Ellis’s results. The red arrow shows where to download the previous results as a PDF.
5. Open the PDF and check the two lines at the top. “Processed in” (blue arrow) shows when Ancestry made the estimate. Ellis’s line says October 2025, so this post calls his previous results his 2025 results. “Downloaded on” (red arrow) shows the day you saved the file. The PDF lists each region with its percentage and range (Figure 6).[4]
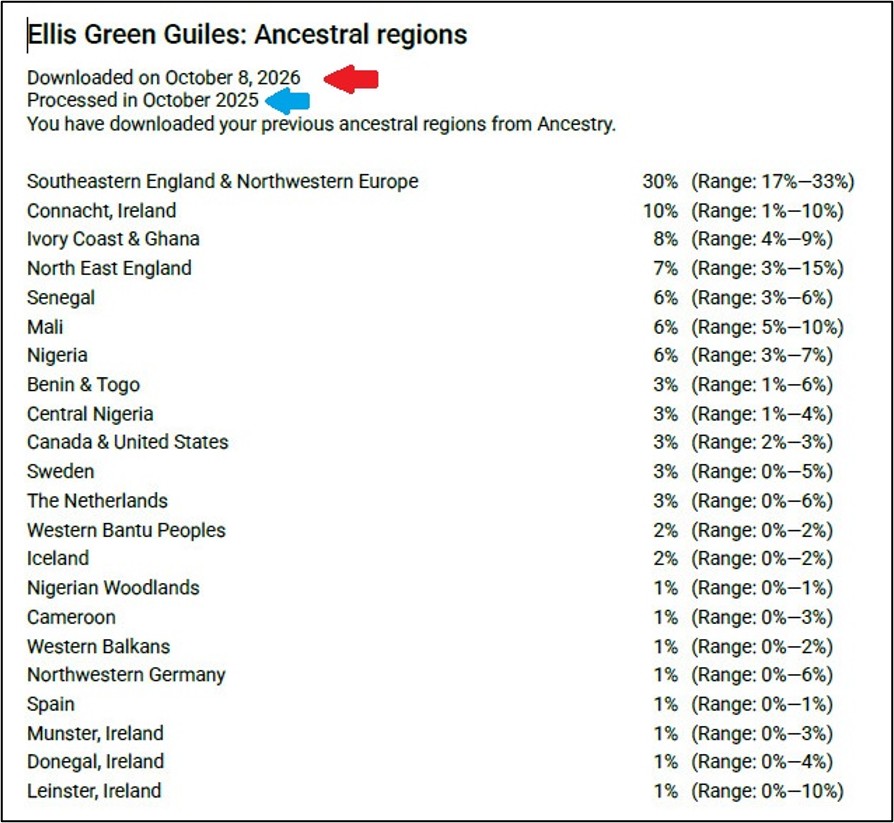
Figure 6. Ellis’s 2025 results, from the PDF.
6. Go back to your Regions page. Take a screenshot of your entire list of regions, from the first heading to the last region, including the update date (Figure 4). If the list is too long for one screenshot, as Ellis’s is, take two. Figures 7 and 8 show Ellis’s 2026 Ancestral Regions.[5]
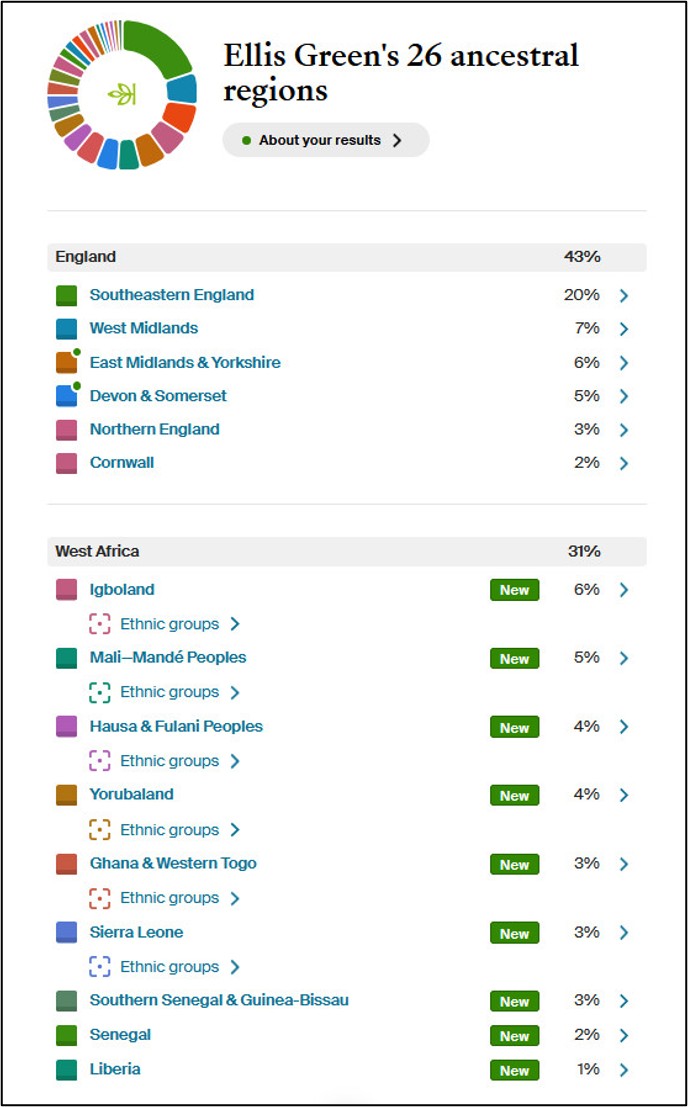
Figure 7. Ellis’s 2026 Ancestral Regions, part 1 of 2: England and West Africa.
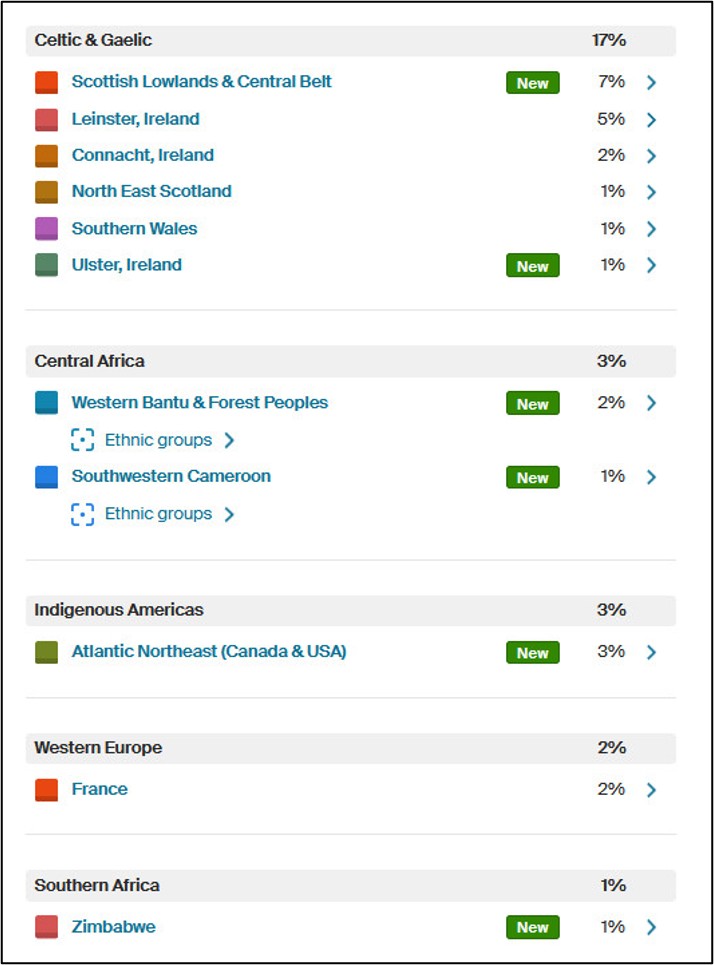
Figure 8. Ellis’s 2026 Ancestral Regions, part 2 of 2: Celtic & Gaelic through Southern Africa.
7. Take a screenshot of the map on the right side of your Regions page. Each colored area on the map matches the colored square beside a region in your list. Step 5 uses this map; Figure 15 shows Ellis’s map.
8. Start every file name with the date, in year-month-day order, so your files sort chronologically. For example, name Ellis’s file 2026-10-11 Ellis Guiles Ancestral Regions.”
A change since Part 1: In “A Plain-English Guide to Ancestry’s 2026 Ancestral Regions Update: Part 1,” I explained that macro-regions are Ancestry’s headings, such as England or West Africa, and that they showed no percentages.[6] By 21 October 2026, three days after Part 1 was posted, Ancestry had added a percentage to each heading (Figures 7 and 8 show England at 43 percent and West Africa at 31 percent). On Ellis’s page, each heading’s percentage equals the total of the percentages for the regions under it. As of 21 October 2026, Ancestry’s help pages have not announced the change. If your page shows no percentages on the headings, add up the percentages for the regions under each heading yourself.
Tip: This post covers only the Regions page, but screenshots of your Journeys, By Parent, and Chromosome Painter pages are worth saving too.
KEY TAKEAWAYS
Save first, analyze second. Ancestry lets you download your previous results for only ninety days after an update. Download your previous results, then save screenshots of your current regions list and map. Start every file name with the date.
2. Look at the continents
Ancestry sorts its 302 regions into five continents: Africa, the Americas, Asia, Europe, and Oceania (Part 1, Figure 1).[7] Add up the percentages for every region in each continent. Ellis’s regions fall into three continents: European regions total 62 percent, African regions 35 percent, and American regions 3 percent (Table 1).
| Continent | October 2026 |
|---|---|
| Africa | 35% |
| Europe | 62% |
| Americas | 3% |
| Total | 100% |
If you have previous results: Add up the percentages in your previous-results PDF by continent the same way. Set those totals aside for Step 5.
KEY TAKEAWAYS
Add up the percentages by continent first. The continent totals give you the big picture before you look at individual regions.
3. Find the subregions
Each continent splits into smaller areas called subregions, such as Western Africa or Northern Europe. Ancestry places each ancestral region in one subregion. Use Ancestry’s interactive list of all regions to find the subregion for each of your regions.[8]
Follow these steps:
1. On the interactive list, click the continent. Ellis’s example starts with Europe (Figure 9), which has eighty regions.
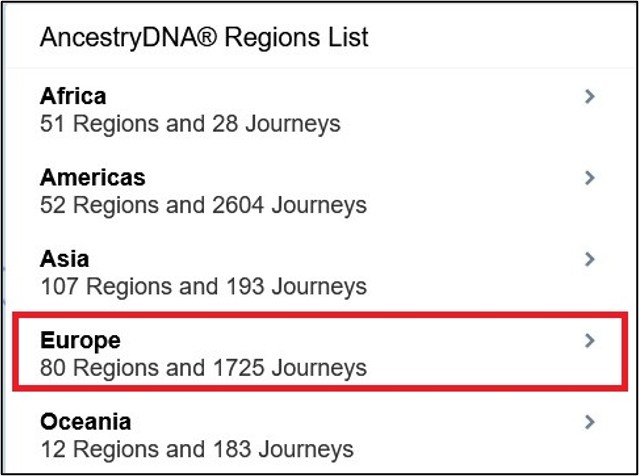
Figure 9. Ancestry’s regions list starts with the continents. Europe is marked with a red box.
2. Click a subregion. Ancestry shows how many regions each subregion holds. Ellis’s example uses Northern Europe (Figure 10), which holds twenty-four regions.
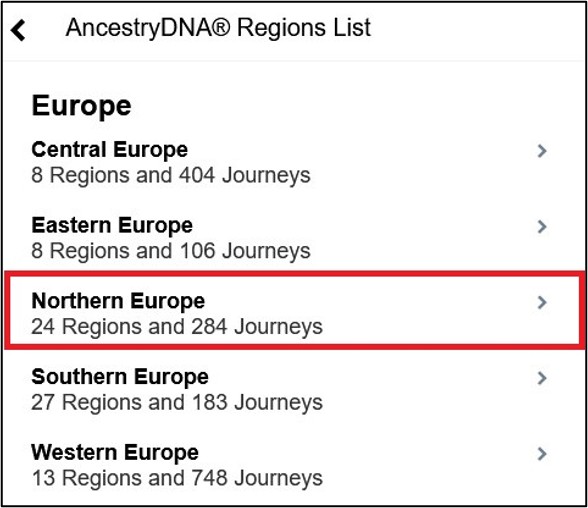
Figure 10. The five subregions of Europe. Northern Europe is marked with a red box.
3. Read the list of regions. Find each of your regions and record its subregion. Figure 11 shows the list for Northern Europe, with red boxes around the twelve regions in Ellis’s results. Cornwall, for example, is one of Ellis’s Northern Europe regions.
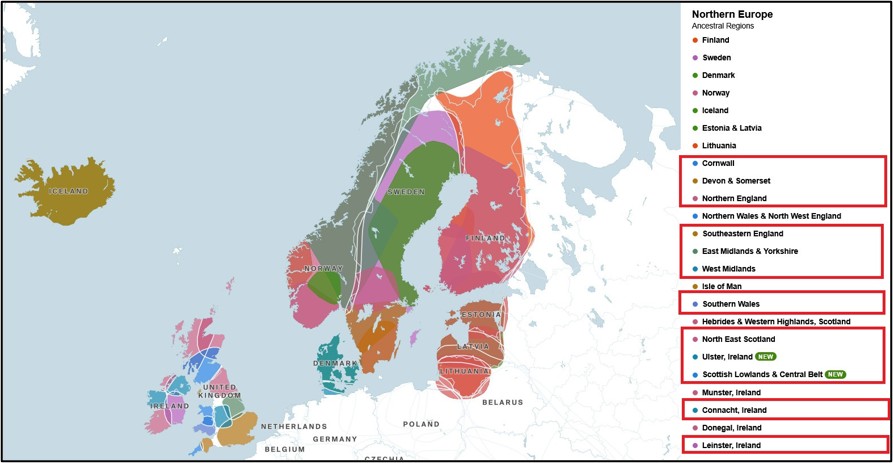
Figure 11. The complete Northern Europe list, with twenty-four regions. The red boxes mark Ellis’s twelve regions in this subregion.
wenty-four regions. The red boxes mark Ellis’s twelve regions in this subregion.
4. Add up the 2026 percentages for each subregion. Table 2 shows Ellis’s 2026 totals by subregion.
| Continent | Subregion | October 2026 |
|---|---|---|
| Europe | Northern Europe | 60% |
| Europe | Western Europe | 2% |
| Africa | Western Africa | 31% |
| Africa | Central Africa | 3% |
| Africa | Southern Africa | 1% |
| Americas | North America | 3% |
| Total | 100% |
Compare macro-regions with subregions
So far, you have added up your regions by subregion using Ancestry’s interactive list. Your Regions page sorts the same regions a second way, under macro-regions. A macro-region is a heading on your Regions page, such as England, West Africa, or Celtic & Gaelic. Ancestry defines them by geography or population.[9]
Figure 12 shows Ellis’s Northern Europe subregion. Each bar represents one region, and the bar’s length shows Ellis’s percentage for that region. The right side of the figure shows the two macro-regions: England (43 percent) and Celtic & Gaelic (17 percent). Add the percentages for the two macro-regions to get the subregion total shown on the left: Northern Europe (60 percent). Every other subregion in Ellis’s results matches a single macro-region. For example, the West Africa macro-region (31 percent) matches the Western Africa subregion (31 percent). Macro-regions and subregions do not always match one to one, so use the headings as a shortcut, then confirm the totals by adding up the regions yourself.
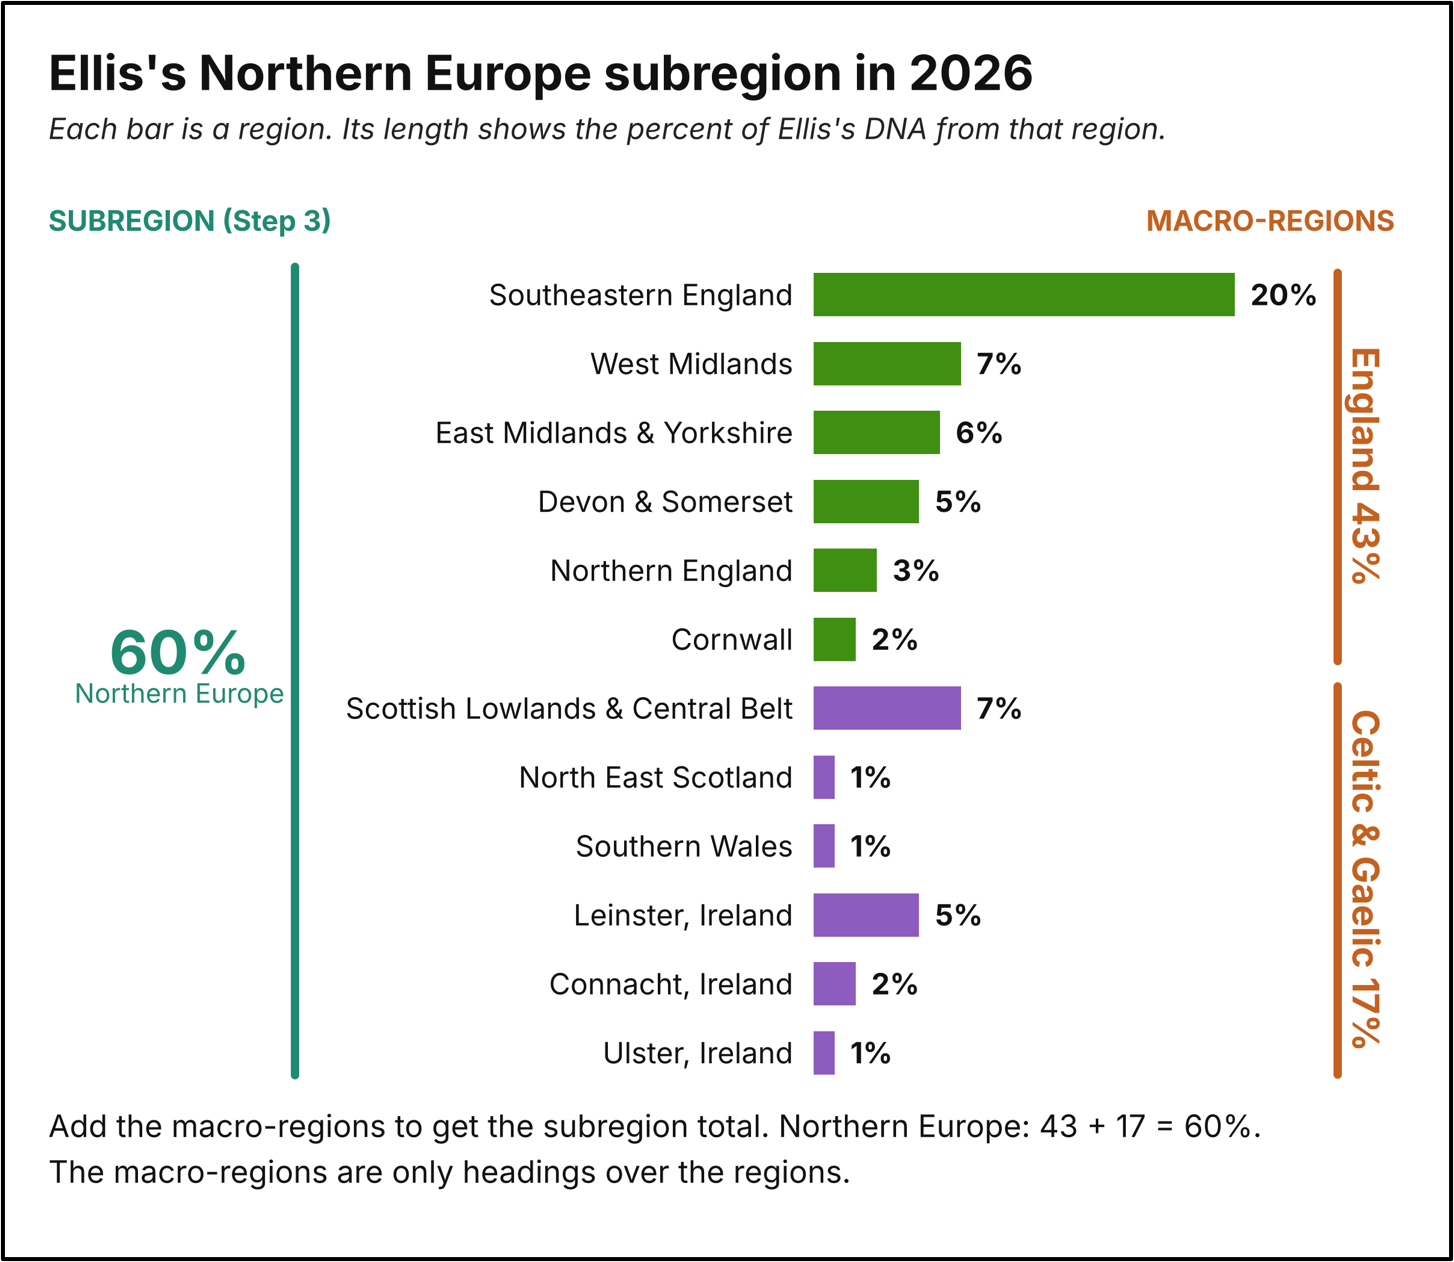
Figure 12. Ellis’s Northern Europe subregion in 2026. The green line on the left shows the subregion total. The orange lines on the right show the macro-regions.
If you have previous results: Add up your previous regions by subregion, the same way you just did for your 2026 results. Your previous-results PDF has no macro-region headings, so you will group the regions yourself. Some older names, such as Nigeria and Ivory Coast & Ghana, have expanded into more regions on Ancestry’s interactive list. Place each one by where it sits on a map. Set your totals aside for Step 5.
KEY TAKEAWAYS
Add up your regions within each subregion. Then compare your subregion totals with the macro-region headings on your Regions page.
4. Read the ranges
Ellis’s 2026 totals are now complete by continent and subregion. Step 4 shows how sure Ancestry is about each region. Part 1 explained that a range is Ancestry’s check on how much to trust a percentage.
To locate the range for each region, follow these steps:
1. Click a region on your Regions page. Then click the “i” icon next to its percentage (red arrow in Figure 13).
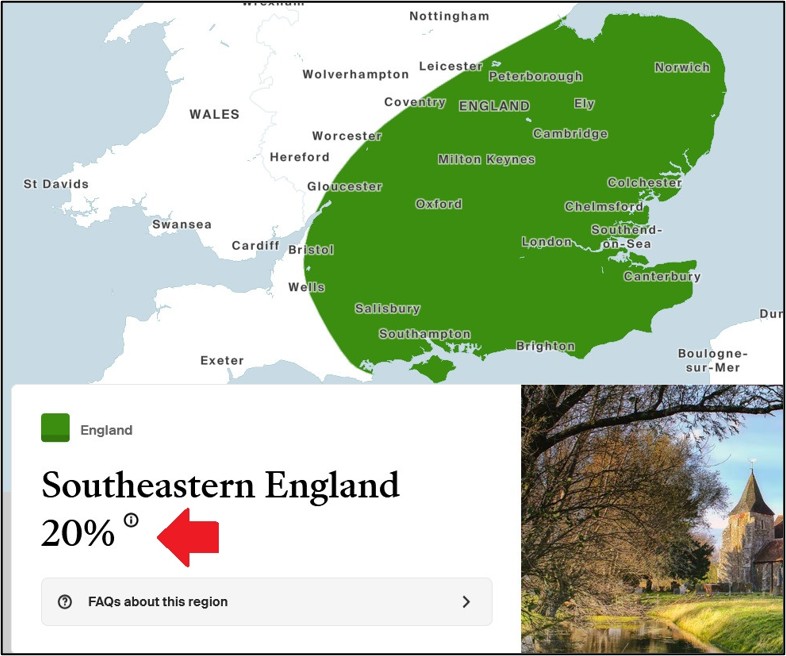
Figure 13. Ellis’s Southeastern England page. Click the “i” icon (red arrow) next to the percent to see the range.
2. Check how wide each range is (red box in Figure 14). A narrow range means Ancestry is more sure about that region. A wide range means Ancestry is less sure.
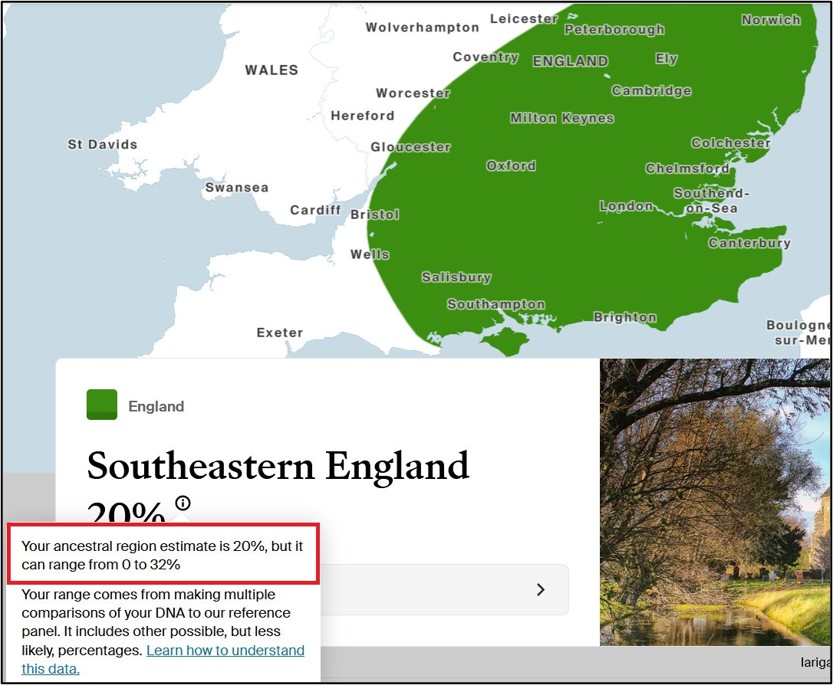
Figure 14. After you click the “i,” Ancestry shows the range (red box). Ellis’s Southeastern England estimate is 20 percent, with a range from 0 to 32 percent.
3. Write down each region’s percentage and range. You will use this list in Step 5.
Figure 15 shows all twenty-six of Ellis’s 2026 estimates (dots) and ranges (bars). Every range starts at 0 percent, and the upper limits run from 6 percent (Atlantic Northeast) to 43 percent (Sierra Leone). The dashed line in Figure 15 marks 5 percent, the point this post uses to call a region small. Ancestry does not say how large a region’s share must be before it appears in your results. The white paper explains only that Ancestry reports regions that reach a minimum share and moves the rest into regions it does report. A region near that minimum can appear in one update and disappear in the next by chance. The white paper also warns that regions assigned below 2.5 percent are missed or wrongly assigned much more often in Ancestry’s own tests.[10]
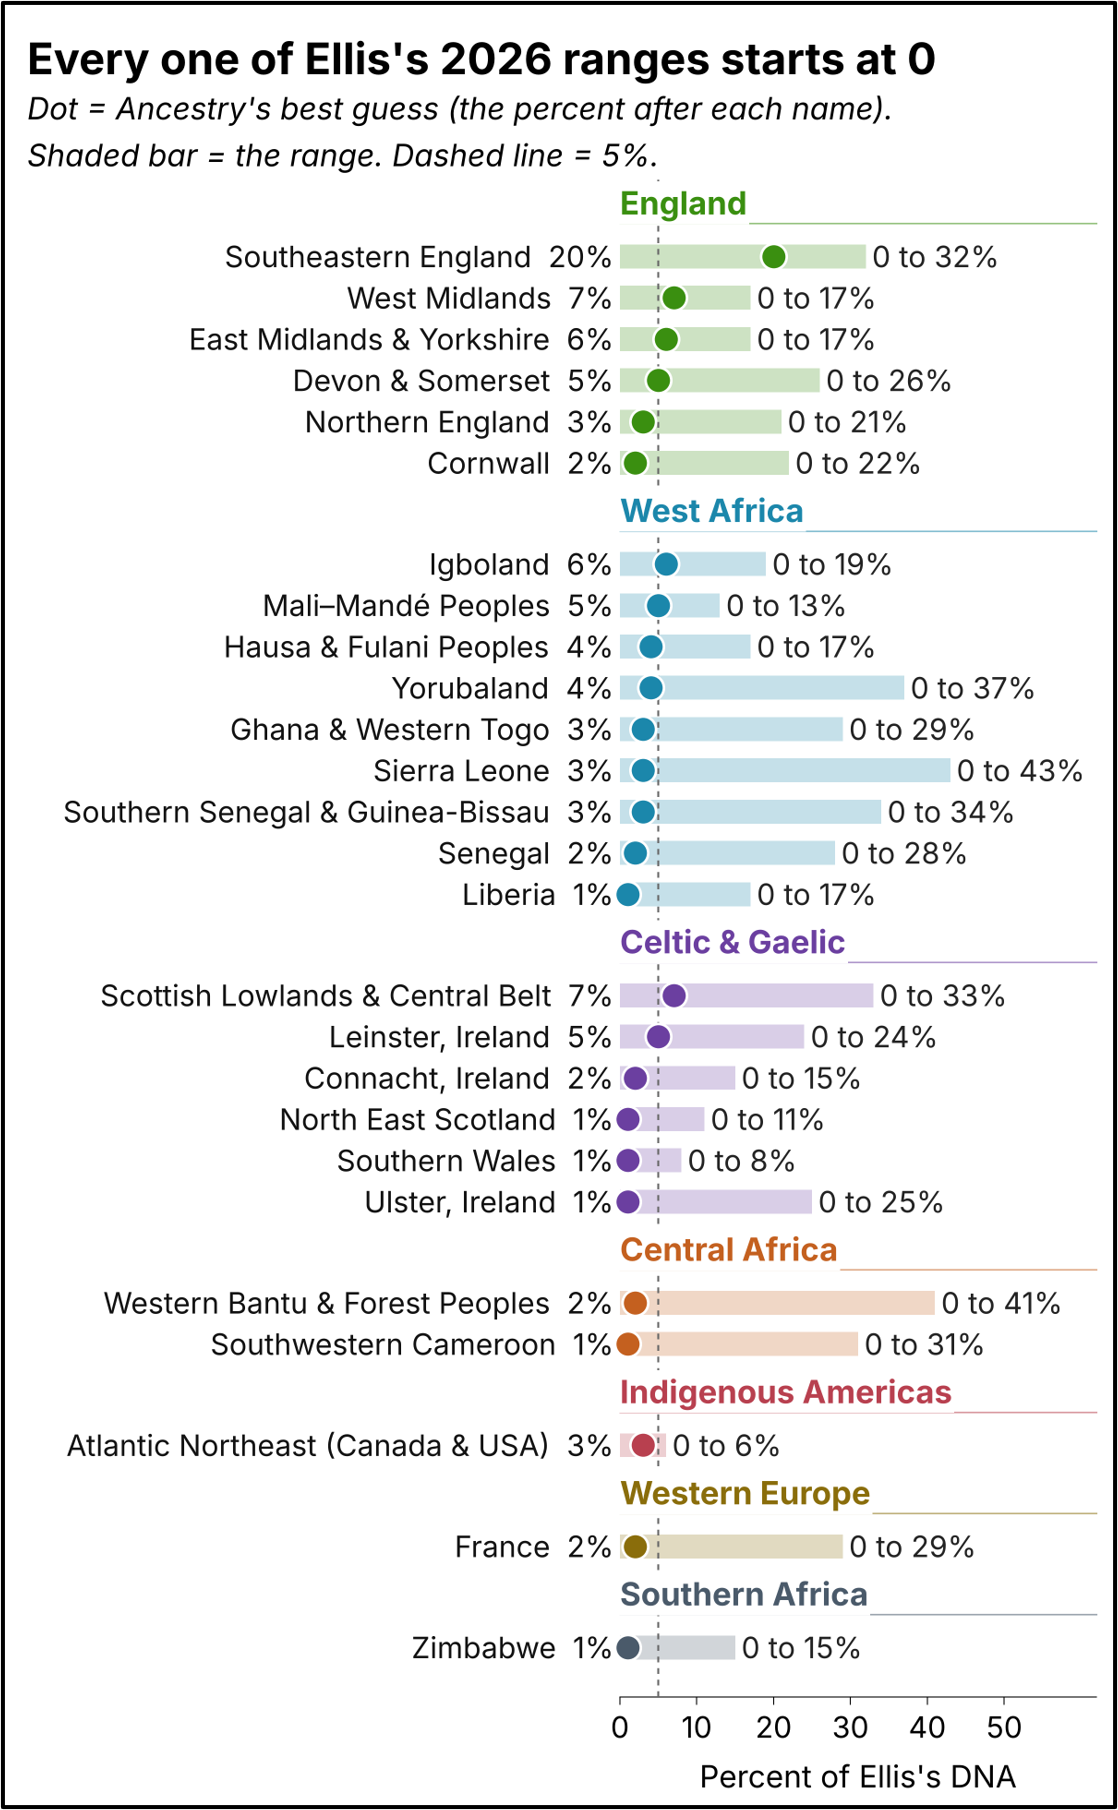
Figure 15. Ellis’s 2026 estimates (dots) and ranges (bars) for all twenty-six of his regions.
If you have previous results: Your previous-results PDF prints the range beside each percentage (Figure 6). Write down those ranges for Step 5.
KEY TAKEAWAYS
The percentage is Ancestry’s best guess. The range tells you how much to trust that guess. The range is as important as the percentage.
5. Analyze and record the results
Steps 2–4 gathered the data. Step 5 looks at what the data might mean. If you have previous results, first analyze what changed and explain each change where you can. Next, write a hypothesis, a testable explanation, only for a change you cannot otherwise explain. Finally, record your findings.
Four patterns to look for when your results change
Anyone who tested before this update can add previous results now. Ellis’s PDF says “Processed in October 2025,” so this post calls Ellis’s previous results his 2025 results. Your PDF may show a different month, such as February 2026 if you tested then. Use the date on your PDF, and expect your previous and current results to differ. If your first results arrived after the 2026 update, you have no previous results to compare, but you can still record your current results. Ellis’s 2025 PDF went through Steps 2, 3, and 4 the same way, and this post puts the two versions side by side.
Start with one fact. Ellis’s DNA did not change between 2025 and 2026. Ancestry’s method did. Ancestry more than doubled the number of regions, from 146 to 302. Ancestry grew the reference panel by about 60 percent, from 185,063 samples to over 295,000. Ancestry also changed how it compares a person’s DNA with the reference panel (Part 1).[11] When a number changes, the first question is what Ancestry changed, not what changed in the family.
Table 3 lists four patterns to look for. Matching your changes to these patterns shows which analysis might fit. Ellis’s results show all four, and each one is worked through below. The patterns follow the order of Steps 2–4: continents, then subregions, then regions and their ranges.
| Pattern seen | It might mean | Check this |
|---|---|---|
| A continent moves by only 1 or 2 points | A side effect of the update (Analysis 1) | Treat the continent total as steady. |
| One place gains, while the places next to it lose about the same amount | DNA was reassigned between neighboring regions (Analysis 2) | Add up the gains and the losses. |
| A region drops to 0, and new regions with new names appear in the same area | Ancestry splits an old region into smaller regions (Analysis 3) | Is the old name still on Ancestry’s interactive list? Compare the subregion total. |
| A region rises or falls, but the new percent sits inside the old range | Normal wobble in the estimate (Analysis 4) | Compare the new percent with the previous range. |
Analysis 1: A continent moves by only one or two points.
What changed: Ellis’s continents barely moved. Africa went from 36 to 35 percent, Europe from 61 to 62 percent, and the Americas stayed at 3 percent. Within the Americas, the 2025 region Canada & United States appears in 2026 as Atlantic Northeast (Canada & USA). Ancestry refined its North American regions, so the two regions are not equivalent. The Americas comparison therefore rests on the continent total, which is 3 percent in both years.
Why this might happen: Two things may explain the 1 percent shift from Africa to Europe. First, Ancestry rounds each region to a whole percent before it adds the totals, so a continent can move 1 percent from rounding alone. Second, the regions closest to the dividing line between the two continents changed. Ellis’s 2025 results included Spain at 1 percent (range 0 to 1 percent). Spain is the part of Europe closest to Africa, just across the Strait of Gibraltar. Ellis’s 2025 and 2026 maps (Figure 16) show Spain shaded in 2025 and France shaded in 2026, and Figure 15 shows France at 2 percent. This shift from Spain to France stays within Europe, so it cannot explain the 1 percent that crossed continents. One hypothesis is that Ancestry’s 2025 reference panel unknowingly included African samples that should have been from Europe. If so, the 2026 update could have moved that 1 percent back to Europe.
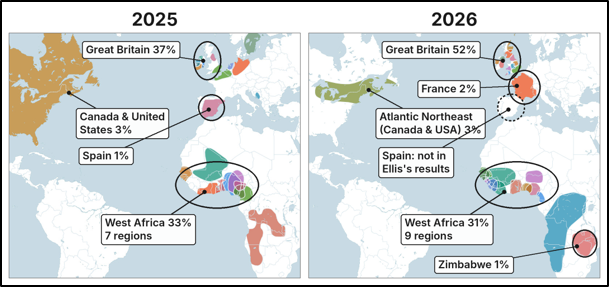
Figure 16. Ellis’s Ancestral Regions maps in 2025 (left) and 2026 (right), shown at the same scale. Ancestry assigns colors again each year, so compare shapes and places, not colors. The shapes are smoothed outlines drawn by Ancestry, not exact borders
Analysis 2: One place gains while its neighbors lose.
What changed: In Northern Europe, three areas stand out: Great Britain, Ireland, and the Nordic countries. Great Britain gained fifteen percentage points, from 37 percent in 2025 to 52 percent in 2026. Ellis’s 2026 Great Britain total adds his six England regions (43 percent), Scottish Lowlands & Central Belt and North East Scotland (8 percent), and Southern Wales (1 percent). Ireland and the Nordic countries lost five percentage points each (Table 4). Figure 17 shows the same changes on the maps.
| Part of Northern Europe | October 2025 | October 2026 | Change |
|---|---|---|---|
| Great Britain (England, Scotland, Wales) | 37% | 52% | +15 |
| Ireland | 13% | 8% | −5 |
| Nordic countries (Sweden, Iceland) | 5% | 0% | −5 |
| Northern Europe total | 55% | 60% | +5 |
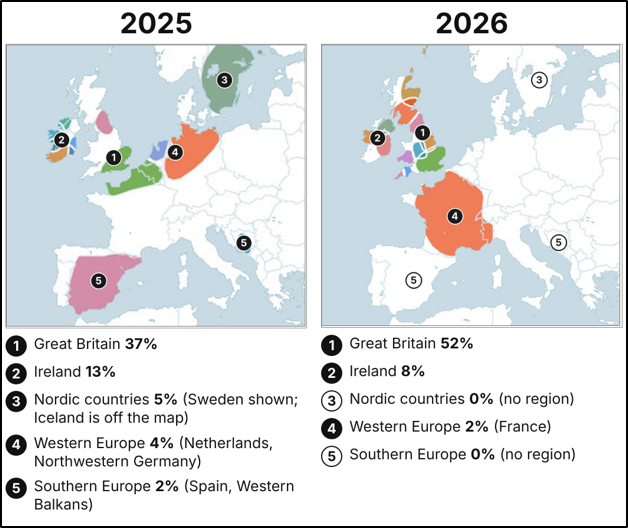
Figure 17. Ellis’s Northern Europe maps, 2025 (left) and 2026 (right), at the same scale. The numbers match the lists below each map. Great Britain (1) gained 15 points, while Ireland (2), the Nordic countries (3), Western Europe (4), and Southern Europe (5) lost 14 points together.
Why this might happen: Ellis’s fifteen-percentage-point gain in Great Britain likely comes from his neighbors’ losses. Ireland and the Nordic countries each lost five percentage points, and Western Europe and Southern Europe each lost two. Those four losses total fourteen percentage points, close to the gain. When one place gains about what its neighbors lose, Ancestry probably reassigned the same DNA. People in neighboring places have moved, married, and traded across borders for centuries, so their DNA is often similar. When Ancestry cannot distinguish two neighbors, it may split a person’s DNA between them.
Two changes in Ancestry’s method could explain why more of that DNA now lands in Great Britain. The update added smaller British regions and expanded the reference panel. With more samples and smaller regions, Ancestry may now place DNA in Great Britain that it once spread across nearby look-alike regions. Three of Ellis’s 2026 regions, Scottish Lowlands & Central Belt, North East Scotland, and Southern Wales (9 percent), did not exist in 2025, so they have no old numbers to compare. Ancestry likely assigned that DNA to other regions in 2025. The 2025 total also needs one caution. This post counts Ellis’s 2025 region “Southeastern England & Northwestern Europe” (30 percent) with Great Britain. The name suggests the region extends beyond England, but the 2025 results do not say how far. If any of that 30 percent came from Northwestern Europe, Ellis’s 2025 Great Britain total would be below 37 percent, and the gain would be even larger.
Analysis 3: A region splits into smaller regions.
What changed: Ellis’s West Africa total barely moved, from 33 to 31 percent, but the regions inside it changed. His 2025 results list seven West African regions, such as Ivory Coast & Ghana (8 percent), Nigeria (6 percent), Central Nigeria (3 percent), and Nigerian Woodlands (1 percent). Ellis’s 2026 results list nine, many named for peoples, such as Igboland and Yorubaland. Table 5 shows West Africa and Central Africa, the two African macro-regions that appear in both years. Figure 18 shows the same change on the maps.
| Macro-region | Regions in 2025 | 2025 | Regions in 2026 | 2026 |
|---|---|---|---|---|
| West Africa | 7 regions (Ivory Coast & Ghana, Mali, Nigeria, Senegal, Benin & Togo, Central Nigeria, Nigerian Woodlands) | 33% | 9 regions (Igboland, Mali–Mandé Peoples, Hausa & Fulani Peoples, Yorubaland, Ghana & Western Togo, Sierra Leone, Southern Senegal & Guinea-Bissau, Senegal, Liberia) | 31% |
| Central Africa | 2 regions (Western Bantu Peoples, Cameroon) | 3% | 2 regions (Western Bantu & Forest Peoples, Southwestern Cameroon) | 3% |
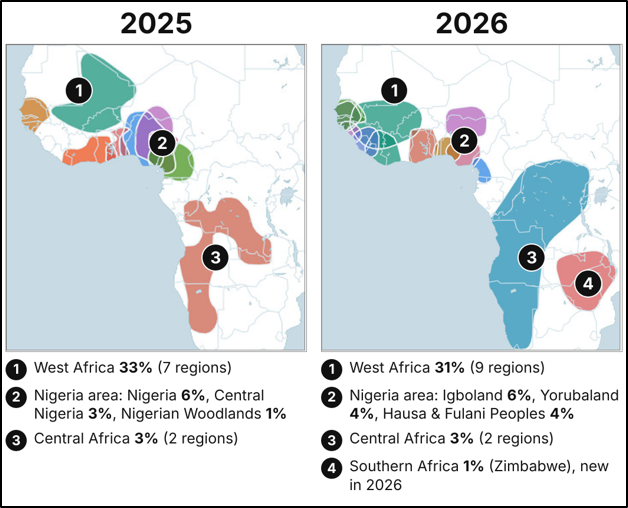
Figure 18. Ellis’s West and Central Africa maps, 2025 (left) and 2026 (right), at the same scale. The Nigeria area (2) has three regions in each year, but none of the names match. Southern Africa (4) is new in 2026.
Why this might happen: Ancestry split some older, larger regions into new, smaller ones. When a region splits, the DNA once assigned to it spreads across the new regions. The land covered stays about the same, but the individual regions change a lot. Ellis’s West Africa results follow this pattern. His subregion total changed by only two percentage points, while his list grew from seven regions to nine and nearly every name changed.
Nigeria is the clearest example. Ancestry now divides Nigeria into several regions, such as Nigeria-Jos Plateau and Nigeria-Middle Belt. In 2025, Ellis’s results listed Nigeria (6 percent), Central Nigeria (3 percent), and Nigerian Woodlands (1 percent). None of these three names appear in his 2026 results, which list Igboland, Yorubaland, and Hausa & Fulani Peoples instead.
Central Africa shows a related change. In 2025, Ellis’s two Central Africa regions were Western Bantu Peoples and Cameroon. His 2026 results list Western Bantu & Forest Peoples and Southwestern Cameroon. The total stayed at 3 percent, but the region names changed. Ancestry refined many regions, so a similar name does not guarantee the same boundaries, and subregion totals are a safer comparison.
Analysis 4: A change stays inside the old range (normal wobble).
What changed: Many of Ellis’s regions moved up or down. Connacht fell from 10 to 2 percent, while Leinster rose from 1 to 5 percent. Sweden, the Netherlands, and Iceland dropped to 0 percent. Figure 19 compares each 2026 percentage with the region’s 2025 range.
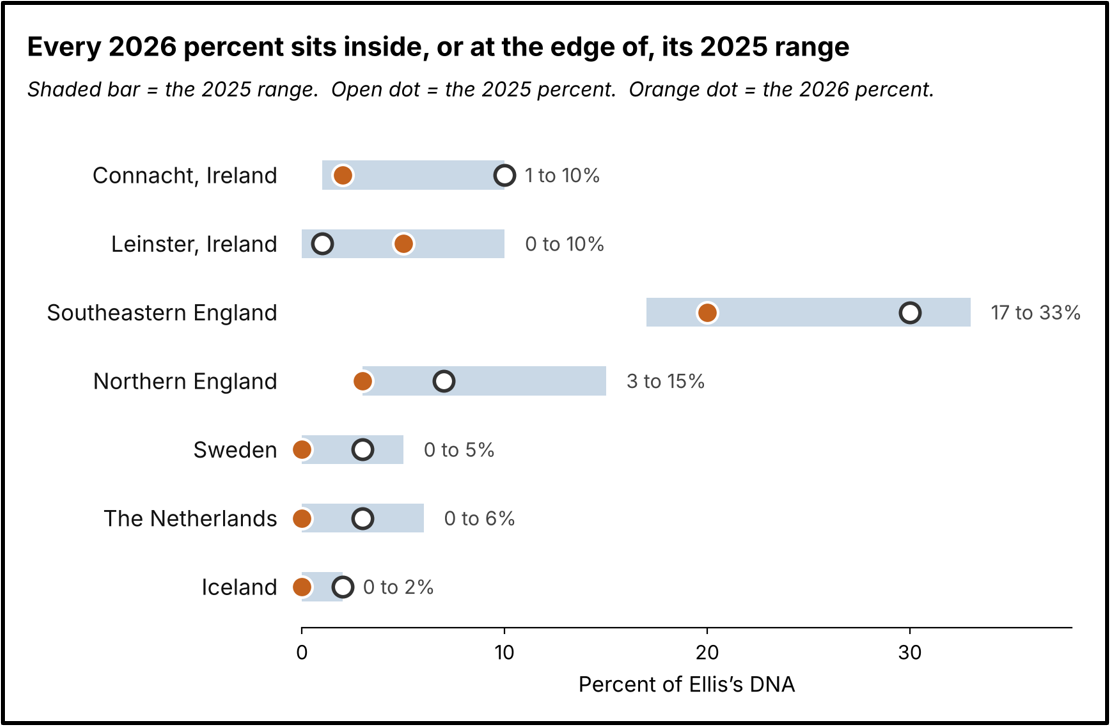
Figure 19. Ellis’s 2025 ranges and percentages compared with his 2026 percentages for seven regions.
Why this might happen: Every percentage is an estimate. Ancestry compares a person’s DNA with the reference panel many times, and each comparison can give a slightly different answer. The range shows how far the answer can move. When a region goes up or down, the first question is whether the new number is still inside the old range.
For Ellis, all seven changes in Figure 19 sit inside, or right at the edge of, the 2025 range. Connacht fell from 10 to 2 percent, but its 2025 range was from 1 to 10 percent, so 2 percent was already possible. Leinster rose from 1 to 5 percent, inside its 2025 range from 0 to 10 percent. Sweden, the Netherlands, and Iceland dropped to 0 percent, and each of their 2025 ranges already included 0. Each of these moves may be nothing more than a new estimate.
Connacht and Leinster show a second pattern. Connacht fell, and Leinster rose, and both are in Ireland. Small regions that sit next to each other can trade percentages from one update to the next. The Ireland total is therefore a better number to watch than any single Irish region.
One caution: Ancestry built the 2025 and 2026 ranges in different ways (Part 1), so compare only the new percentage with the old range.[13] Do not compare the two ranges with each other. Also, being inside the old range does not prove a change is meaningless, and being outside does not prove it is real. A region that keeps bouncing from update to update is likely wobble.
Build research questions on regions under 5 percent, the dashed line in Figure 15, with care. A small percentage does not make a region wrong. Before relying on one, test it against the paper trail and DNA matches.
Record the findings
A simple log makes it easy to compare the next update. Work from the broadest level to the narrowest: continent, subregion, then region. For each, write down the percentage from each version, plus the range for a region. Add notes on which of the four analyses it fits and any hypothesis to test. Table 6 shows part of Ellis’s log, matched to the four analyses in this step.
| Level | Name | 2025 | 2026 | Notes and analysis |
|---|---|---|---|---|
| Continent | Europe | 61% | 62% | Analysis 1: one-point change; treat as steady |
| Continent | Africa | 36% | 35% | Analysis 1: one-point change; treat as steady |
| Subregion | Northern Europe | 55% | 60% | Analysis 2: Great Britain 37% to 52%; Ireland and the Nordic countries lost 5 points each |
| Subregion | Western Africa | 33% | 31% | Analysis 3: regions split and renamed; compare the subregion total. |
| Region | Southeastern England (2025: Southeastern England & Northwestern Europe) | 30% (17–33%) | 20% (0–32%) | Analysis 4: inside the 2025 range |
KEY TAKEAWAYS
Gather first, then analyze. A change between updates may come from Ancestry’s method, or it may point to a question to test. Write down your findings.
Coming Next: Part 3 will turn Ellis’s Ancestral Regions results into a research objective, build a research plan from the objective, and work through the research plan.
Notes
[1] Yvonne Fenster, “A Plain-English Guide to Ancestry’s 2026 Ancestral Regions Update: Part 1,” 18 October 2026, FamilyLocket (https://familylocket.com/a-plain-english-guide-to-ancestrys-2026-ancestral-regions-update-part-1/ : accessed 21 Oct 2026).
[2] “Updates to Ancestral Regions,” Ancestry (https://help.ancestry.com/hc/en-us/articles/53933331274259-Updates-to-Ancestral-Regions : accessed 21 Oct 2026).
[3] “What changed?” database report, Ancestry (https://ancestry.com : accessed 8 Oct 2026); Ellis Green Guiles Ancestral Regions 2025 compared to 2026;
“What changed?” database report, Ancestry (https://ancestry.com : accessed 21 Oct 2026); Ellis Green Guiles Ancestral Regions Previous compared to Current.
[4] “Ellis Green Guiles: Ancestral regions,” Processed October 2025, database report, Ancestry (https://ancestry.com : accessed 8 Oct 2026).
[5] “Ellis Green Guiles: Ancestral Regions,” October 2026, database report, Ancestry (https://ancestry.com : accessed 21 Oct 2026).
[6] Yvonne Fenster, “A Plain-English Guide to Ancestry’s 2026 Ancestral Regions Update: Part 1,” 18 October 2026, FamilyLocket (https://familylocket.com/a-plain-english-guide-to-ancestrys-2026-ancestral-regions-update-part-1/ : accessed 21 Oct 2026).
[7] Yvonne Fenster, “A Plain-English Guide to Ancestry’s 2026 Ancestral Regions Update: Part 1,” 18 October 2026, FamilyLocket (https://familylocket.com/a-plain-english-guide-to-ancestrys-2026-ancestral-regions-update-part-1/: accessed 21 Oct 2026).
[8] “Ethnicity & Origin,” Ancestry (https://www.ancestry.com/ethnicity/all-regions : accessed 13 Oct 2026).
[9] Yvonne Fenster, “A Plain-English Guide to Ancestry’s 2026 Ancestral Regions Update: Part 1,” 18 October 2026, FamilyLocket (https://familylocket.com/a-plain-english-guide-to-ancestrys-2026-ancestral-regions-update-part-1/ : accessed 21 Oct 2026).
“AncestryDNA Regions and Journeys FAQ,” Ancestry (https://help.ancestry.com/hc/en-us/articles/53933322469779-AncestryDNA-Regions-and-Journeys-FAQ : accessed 21 Oct 2026).
[10] Rekha Angara, et al., “Ancestral Regions 2026 White Paper,” 8 Oct 2026, p. 18.
[11] Yvonne Fenster, “A Plain-English Guide to Ancestry’s 2026 Ancestral Regions Update: Part 1,” 18 October 2026, FamilyLocket (https://familylocket.com/a-plain-english-guide-to-ancestrys-2026-ancestral-regions-update-part-1/ : accessed 21 Oct 2026).
[12] Rekha Angara, et al., “Ancestral Regions 2026 White Paper,” 8 Oct 2026, p. 23.
[13] Yvonne Fenster, “A Plain-English Guide to Ancestry’s 2026 Ancestral Regions Update: Part 1,” 18 October 2026, FamilyLocket (https://familylocket.com/a-plain-english-guide-to-ancestrys-2026-ancestral-regions-update-part-1/ : accessed 21 Oct 2026).







Leave a Reply
Thanks for the note!