
Every few years, AncestryDNA customers open their results and find that their ancestral regions have changed, even though their DNA hasn’t. The 2026 update is one of the biggest yet. Ancestry now reports 302 ancestral regions, up from 146 in 2025, and it rebuilt much of the method behind the estimates: a reference panel of more than 295,000 samples, a new way of comparing your DNA to that panel, and an AI transformer in place of the older smoothing model.
Ancestry’s white papers explain these changes, but they are dense and written for scientists, not for genealogists trying to decide what a new percentage means for their research. In this two-part series, Yvonne Fenster, one of our DNA experts at Family Locket Genealogists, translates the 2025 and 2026 white papers into plain English, using a library analogy to walk through how a DNA test becomes a list of regions. Yvonne flags the places where the white papers leave questions unanswered. With a Bachelor of Science in Biology and a PhD in Neuroscience and Physiology, Yvonne brings her scientific expertise to genealogy.
Part 1 explains how the estimates work and what changed from 2025 to 2026. Part 2 will walk through a step-by-step process for analyzing your own results, using her dad, Ellis Green Guiles’ ancestral regions as the example.
-Diana
How Ancestry’s estimates work
Ancestral Regions
Ancestral regions are locations in the world. They point to the people, cultures, and histories of areas where your ancestors may have lived 1,000+ years ago.[1] Ancestry’s older name for ancestral regions was “ethnicity estimates,” and many people still use that term.
In 2026, Ancestry reports 302 ancestral regions, up from 146 in 2025.[2] Ancestry lists regions sorted into three levels (Figure 1).[3] The top level is the continent: Africa, the Americas, Asia, Europe, or Oceania. Four of the five continents are divided into subregions, such as Western Africa or Southern Europe. Oceania has no subregions. Lastly, subregions are divided into regions such as the Southern Bantu People in Southern Africa. The diagram shows only the regions for Southern Africa due to space constraints. The third division, regions, is where Ancestry increased the number by 156. To browse every region, see Ancestry’s interactive list of all regions.[4]
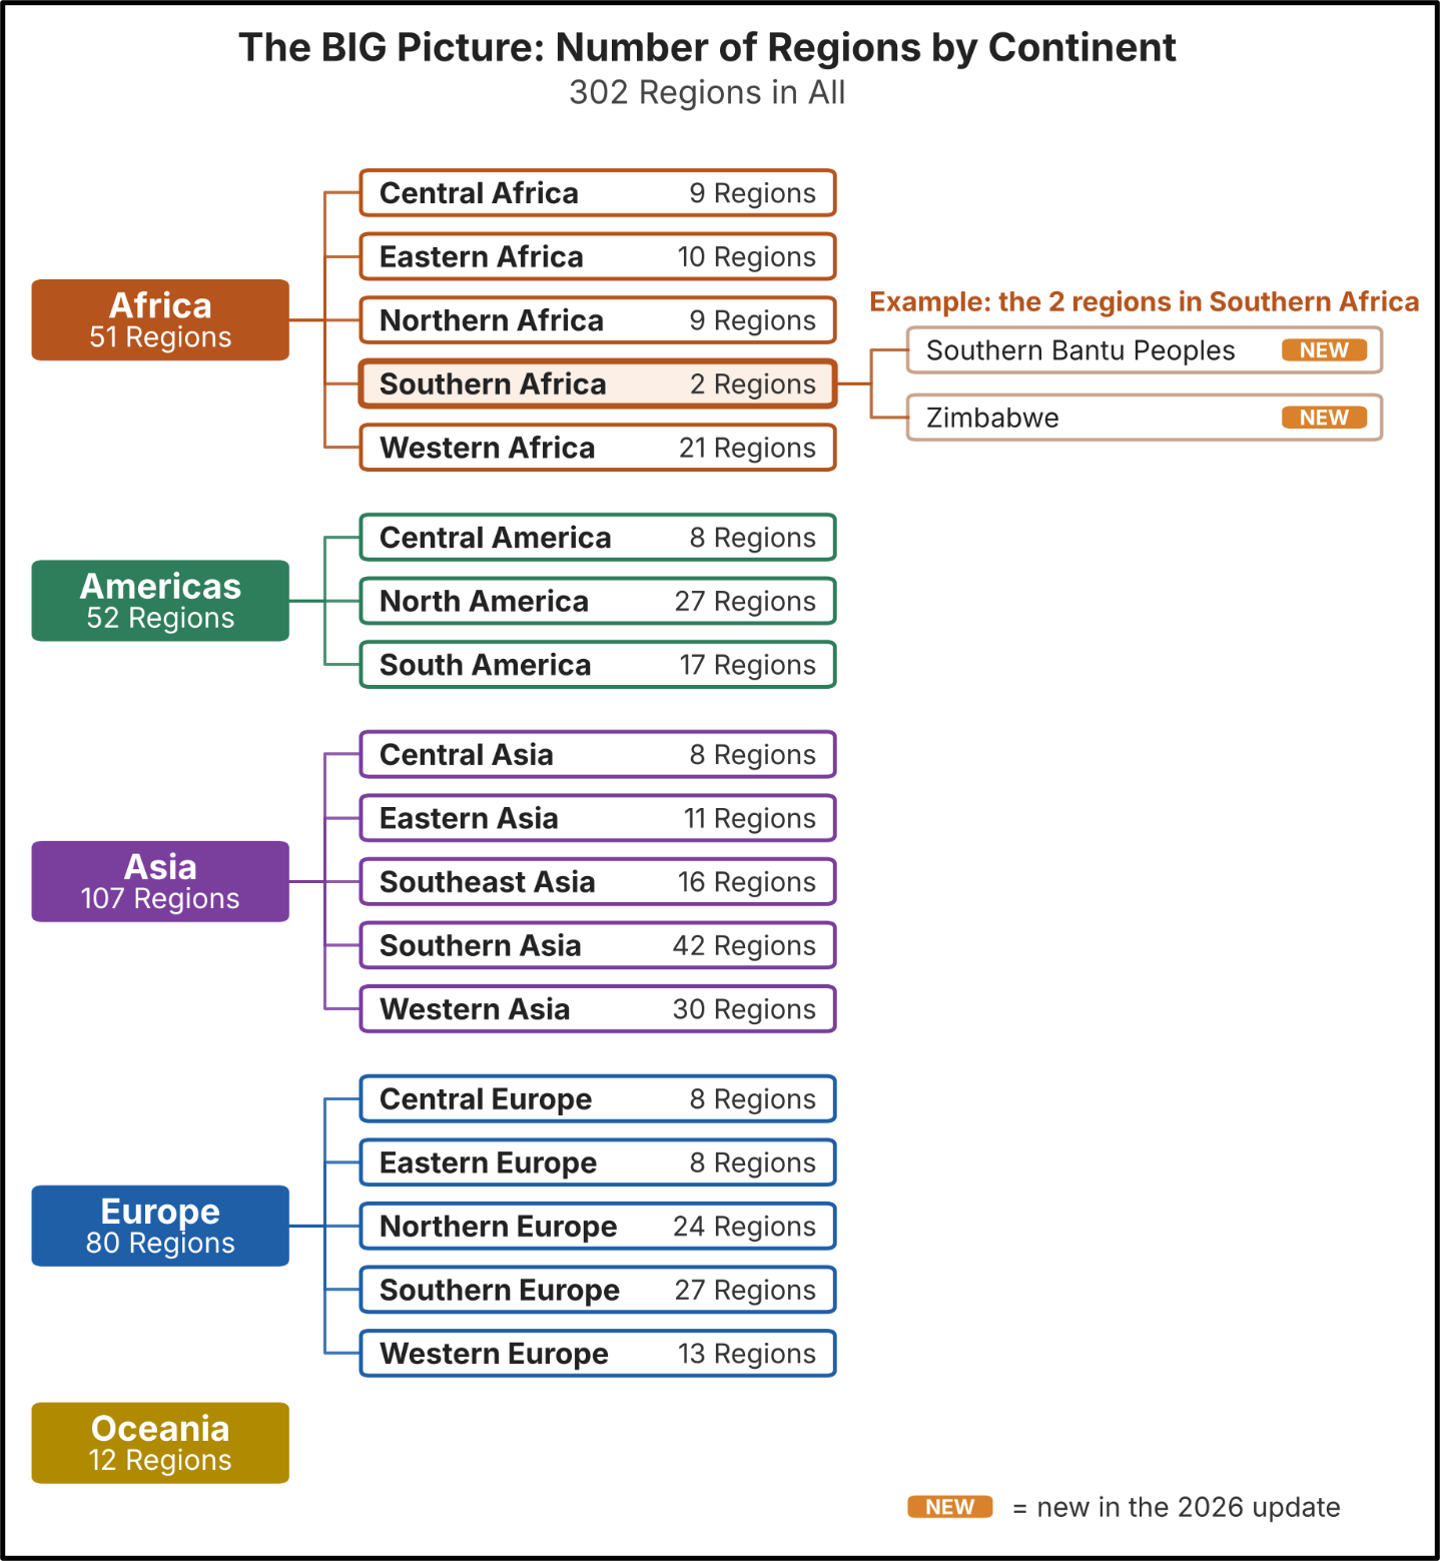
Figure 1. Ancestry divides the world into five continents, each represented by a different number of regions.
Asia has the most regions (107), followed by Europe (80), the Americas (52), Africa (51), and Oceania (12). Asia and Europe together hold 187 of the 302 regions, about 62 percent. A larger count means Ancestry has more separate regions to choose from in that part of the world.
Macro-regions bundle smaller regions into larger labels.[5] Examples include “Celtic & Gaelic,” “Central & Eastern Europe,” and “West Africa.” Ancestry determines macro-regions by geography or population. Macro-regions make results easier to read at a glance, and Ancestry says they should change less from year to year than specific regions do.[6] Ancestry does not derive macro-regions from your DNA, and macro-regions have no reference panel of their own. They carry no percentages. Only specific regions do.
Macro-regions are not the same as the continents and subregions in Figure 1.[7] Figure 1 follows Ancestry’s all-regions page, which lists the 302 regions by continent, subregion, and region. Macro-regions are a separate grouping that appears in your own results, where Ancestry groups your specific regions under them.[8] Ancestry’s pages name only a few macro-regions and don’t publish a complete list, so your results are the best place to see how Ancestry grouped your regions.
Lastly, in 2026, Ancestry added “ethnic groups” to the African continent. Ancestry defines the term this way:[9]
An ethnic group is a community of people who share common cultural characteristics, such as language, religion, and customs (and often ancestral ties, like the Yoruba and Zulu peoples). In a genetically diverse continent that is as geographically large as Africa, communities evolve over time, and boundaries change. We partnered with Ethnologue/Derivation to help us map these regions.
KEY TAKEAWAYS
An ancestral region shows what share of your DNA looks most similar to people with long histories (1,000 or more years) in a place. Macro-regions only group regions together and do not get a percentage. Africa now has ethnic groups.
Step 1: What the DNA test actually reads
It is easy to imagine a DNA test reading all of your DNA and marking stretches “Irish” or “Nigerian.” AncestryDNA does not work that way. AncestryDNA uses a microarray, a chip that reads the four nucleotides that make up DNA: Adenine (A), Thymine (T), Cytosine (C), and Guanine (G). In both 2025 and 2026, the microarray analyzed about 700,000 chosen nucleotides called SNPs (single nucleotide polymorphisms) across chromosomes 1 to 22 and the X chromosome.[10] Those 700,000 SNPs are a sample, not a complete reading of your DNA.
A single SNP tells you very little, because plenty of people carry an A at a given spot. The useful signal comes from patterns across many SNPs, which Ancestry compares with the patterns in a reference panel. In 2026, Ancestry compared about 400,000 SNPs with its reference panels, up from about 300,000 in 2025 (Figure 2).[11] More SNPs give the algorithm more evidence for each comparison and can help it distinguish neighboring regions.
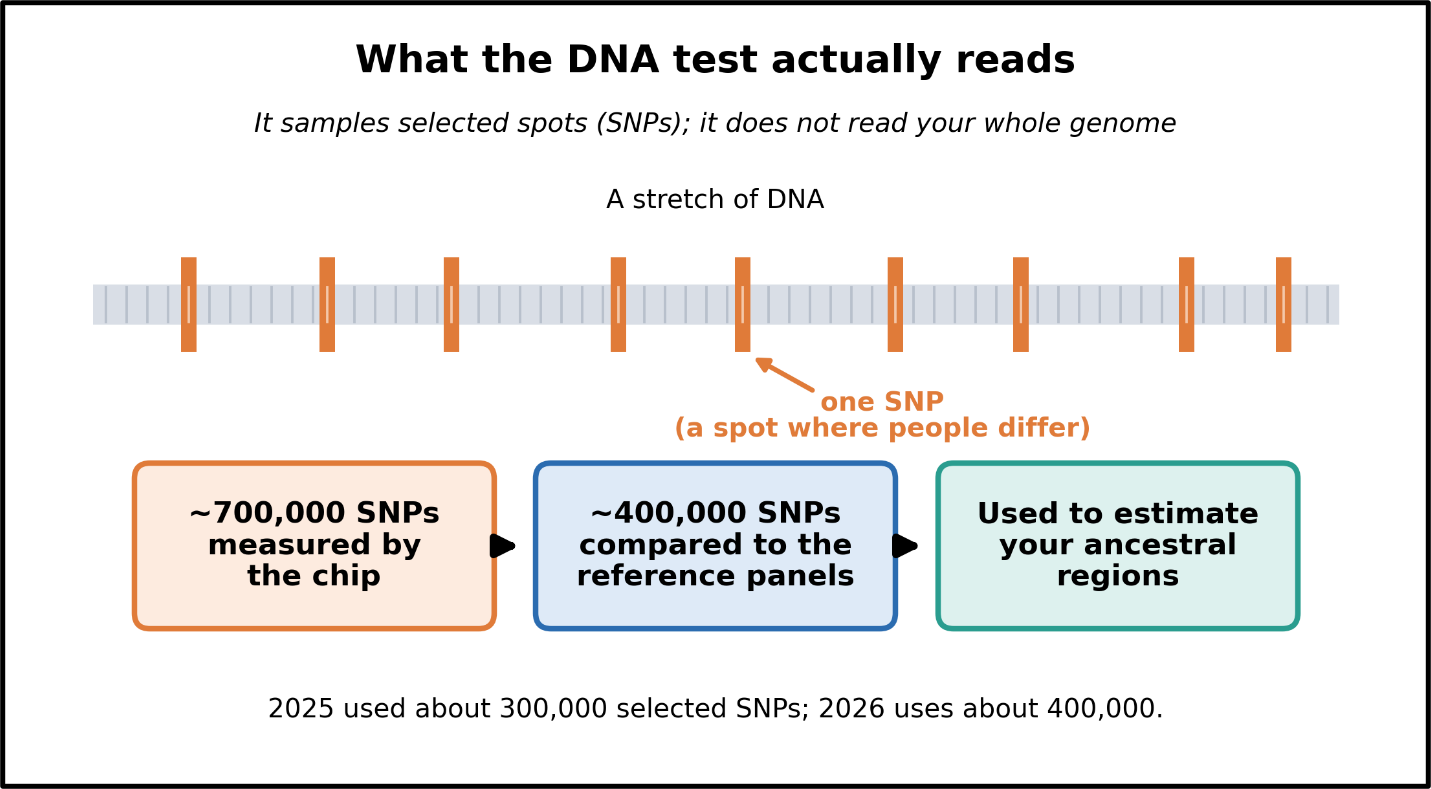
Figure 2. From 2025 to 2026, Ancestry increased the number of SNPs it compares in its reference panels.
KEY TAKEAWAYS
Ancestry does not read the full genome and takes a test sample of about 700,000 chosen spots. About 400,000 SNPs are used to determine regional estimates.
Step 2: Separating the DNA from each parent
You carry two copies of every chromosome, one from each parent. The microarray chip reads both copies together, so at each SNP the chip sees a pair of letters, such as A/G, without knowing which letter came from which parent. Before assigning regions, Ancestry sorts the letters into two piles. This sorting is called phasing, and each pile is a haplotype.
Ancestry’s phasing tool, SideView™, uses DNA you share with relatives in the database to decide which letters belong together (Figure 3).[12] Phasing is therefore less certain for people who have few DNA relatives.[13] Phasing can also accidentally swap the two parental copies partway along a chromosome, as if the mother’s and father’s stories traded places. The 2026 method looks for those switch points and repairs them.
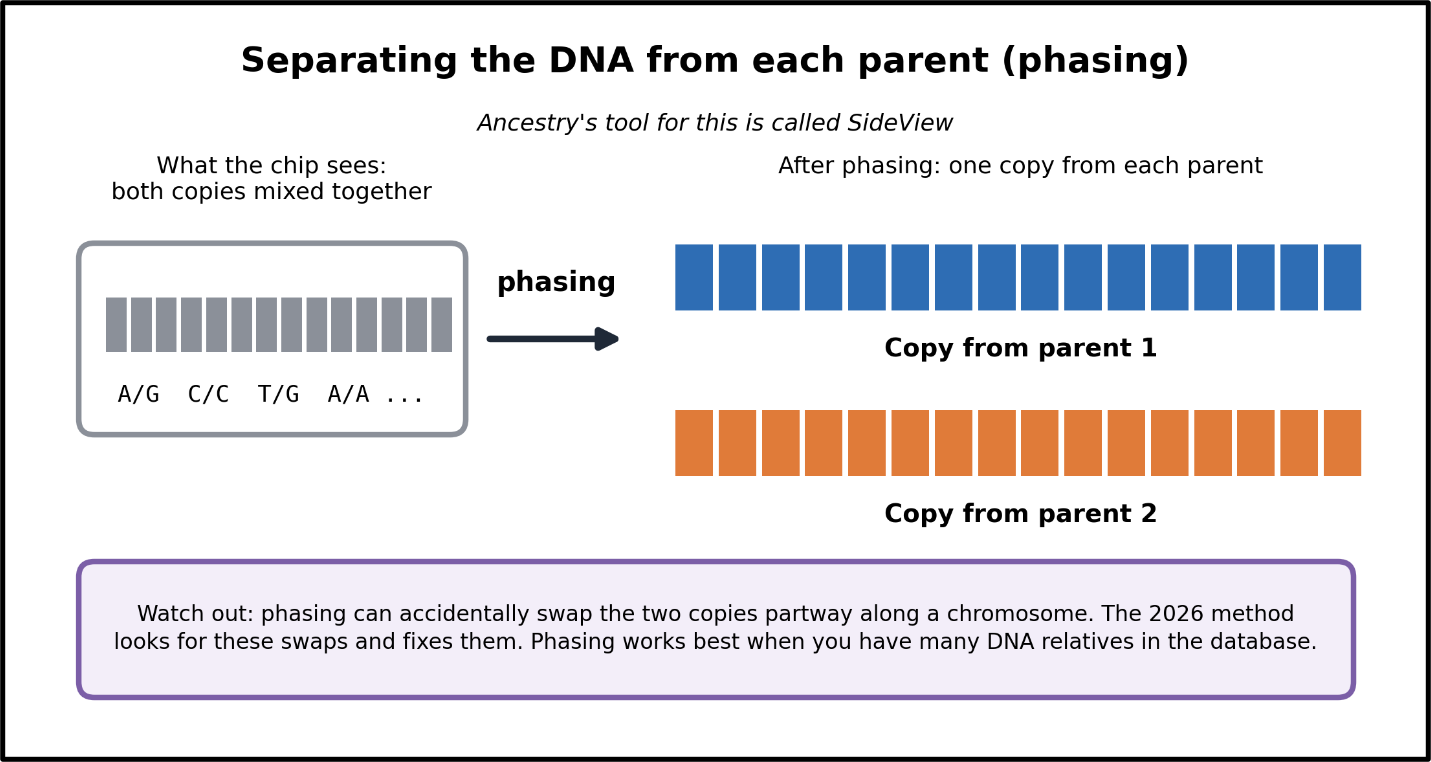
Figure 3. Phasing sorts the mixed pair of letters into a copy from each parent.
KEY TAKEAWAYS
Phasing sorts your DNA into a copy from each parent. It helps you guess which side a region came from, but it is only as good as the relatives in the database, and it can slip.
Step 3: Cutting the genome into windows
Ancestry does not judge your DNA all at once. Ancestry cuts each parental copy into stretches called windows and asks one question about each window: which reference panel does this stretch of DNA most resemble? A window is a location along a chromosome (Figure 4). In one person, one parent’s copy may best match one reference panel, while the other parent’s copy matches a different one. In 2025, Ancestry used 1,001 windows.[14] The 2026 white paper says only that Ancestry uses “a large number.”[15] The 2025 number cannot be assumed to carry over to 2026.
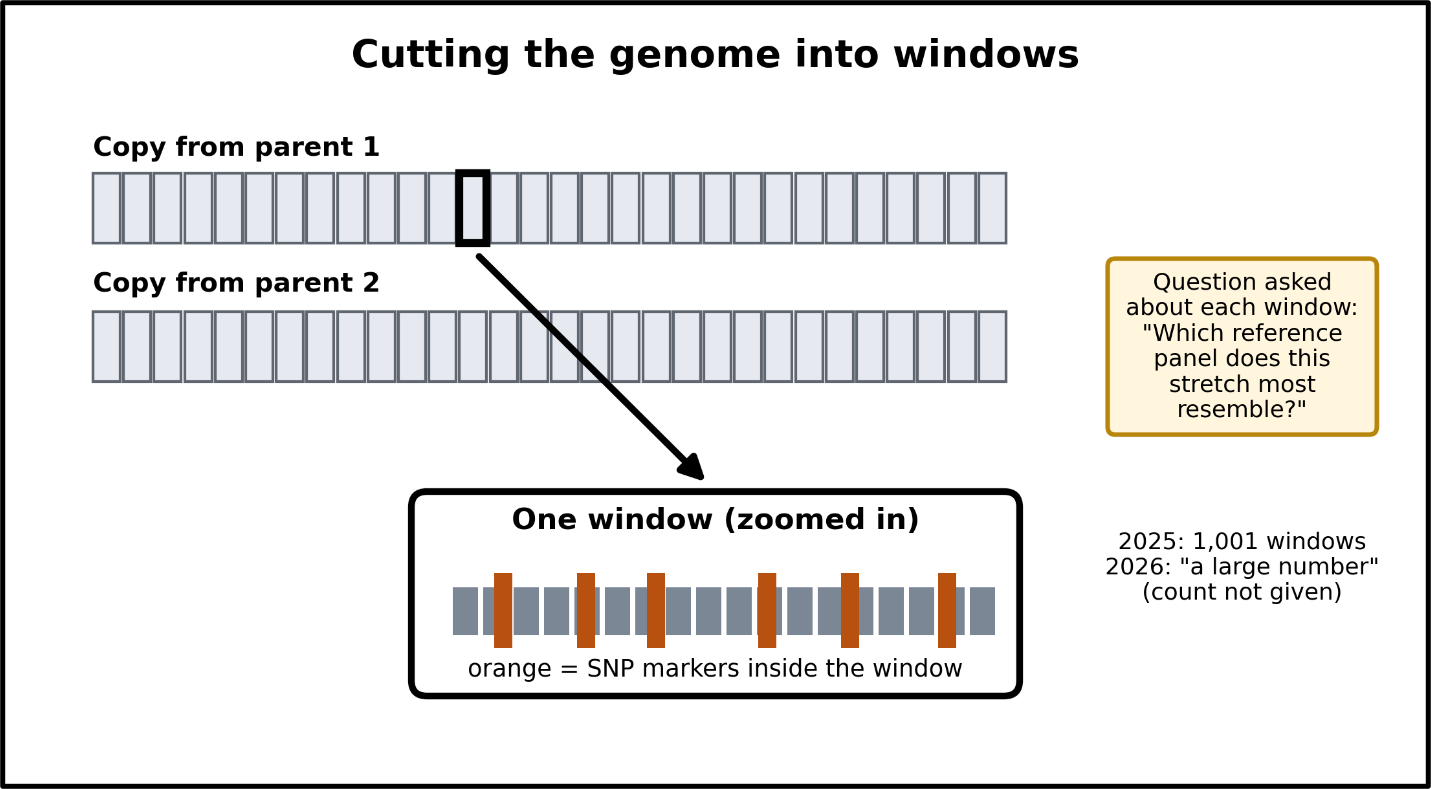
Figure 4. Each window is judged separately against a reference panel.
KEY TAKEAWAYS
A window is a stretch of DNA SNPs. Ancestry asks which reference panel each window resembles, then adds up the answers.
Step 4: The reference panel is a library of examples
A reference panel is a set of people whose DNA is typical of a place or population.[16] Think of the reference panels as a library with one shelf for each region: a shelf for Eastern Slovakia, a shelf for Southeastern England, a shelf for Ethiopia, and so on. The books on each shelf come from people whose DNA Ancestry has chosen to represent that region. Together, the books on one shelf make up that region’s reference panel (Figure 5).
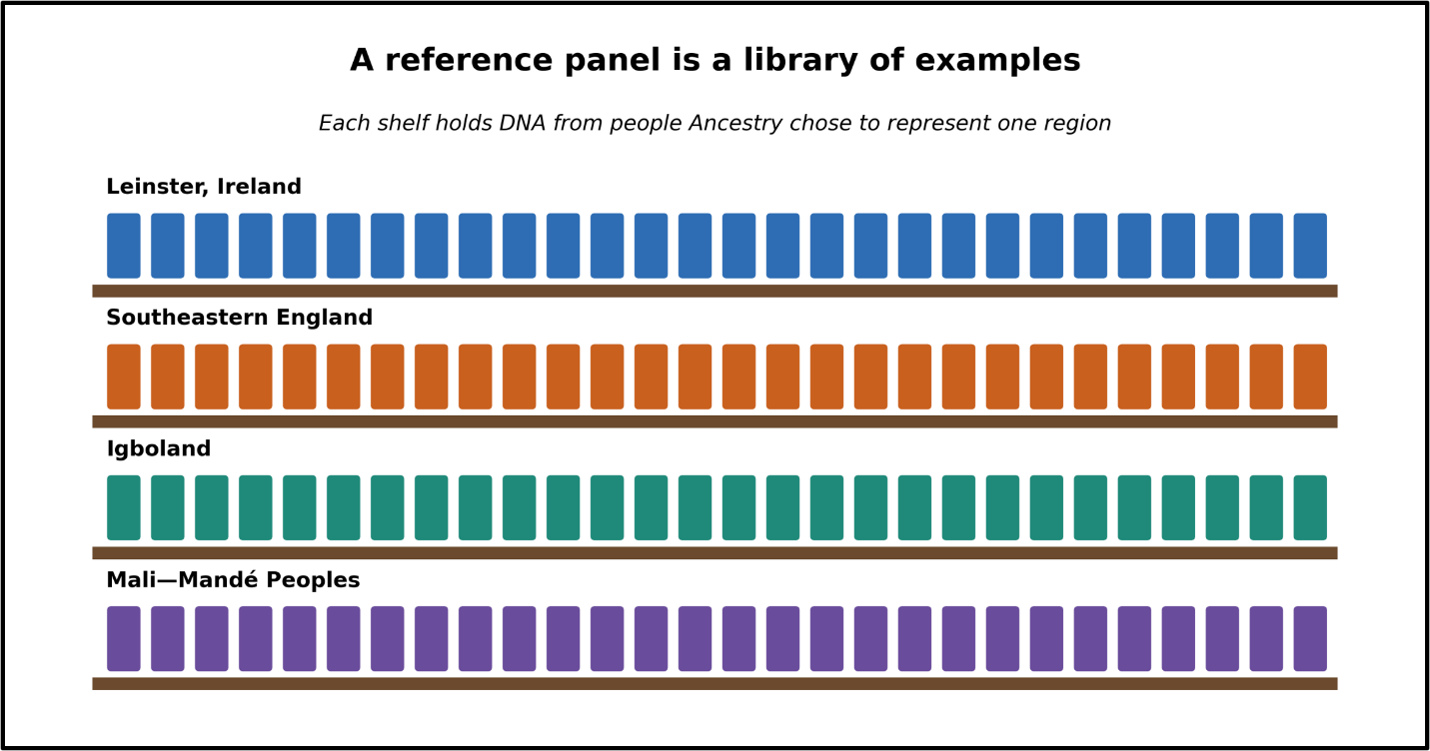
Figure 5. The reference panel is a library of examples.
Three ways Ancestry builds a reference panel
The 2026 white paper describes three ways Ancestry built its reference panel, each with its own method (Figure 6).[17]
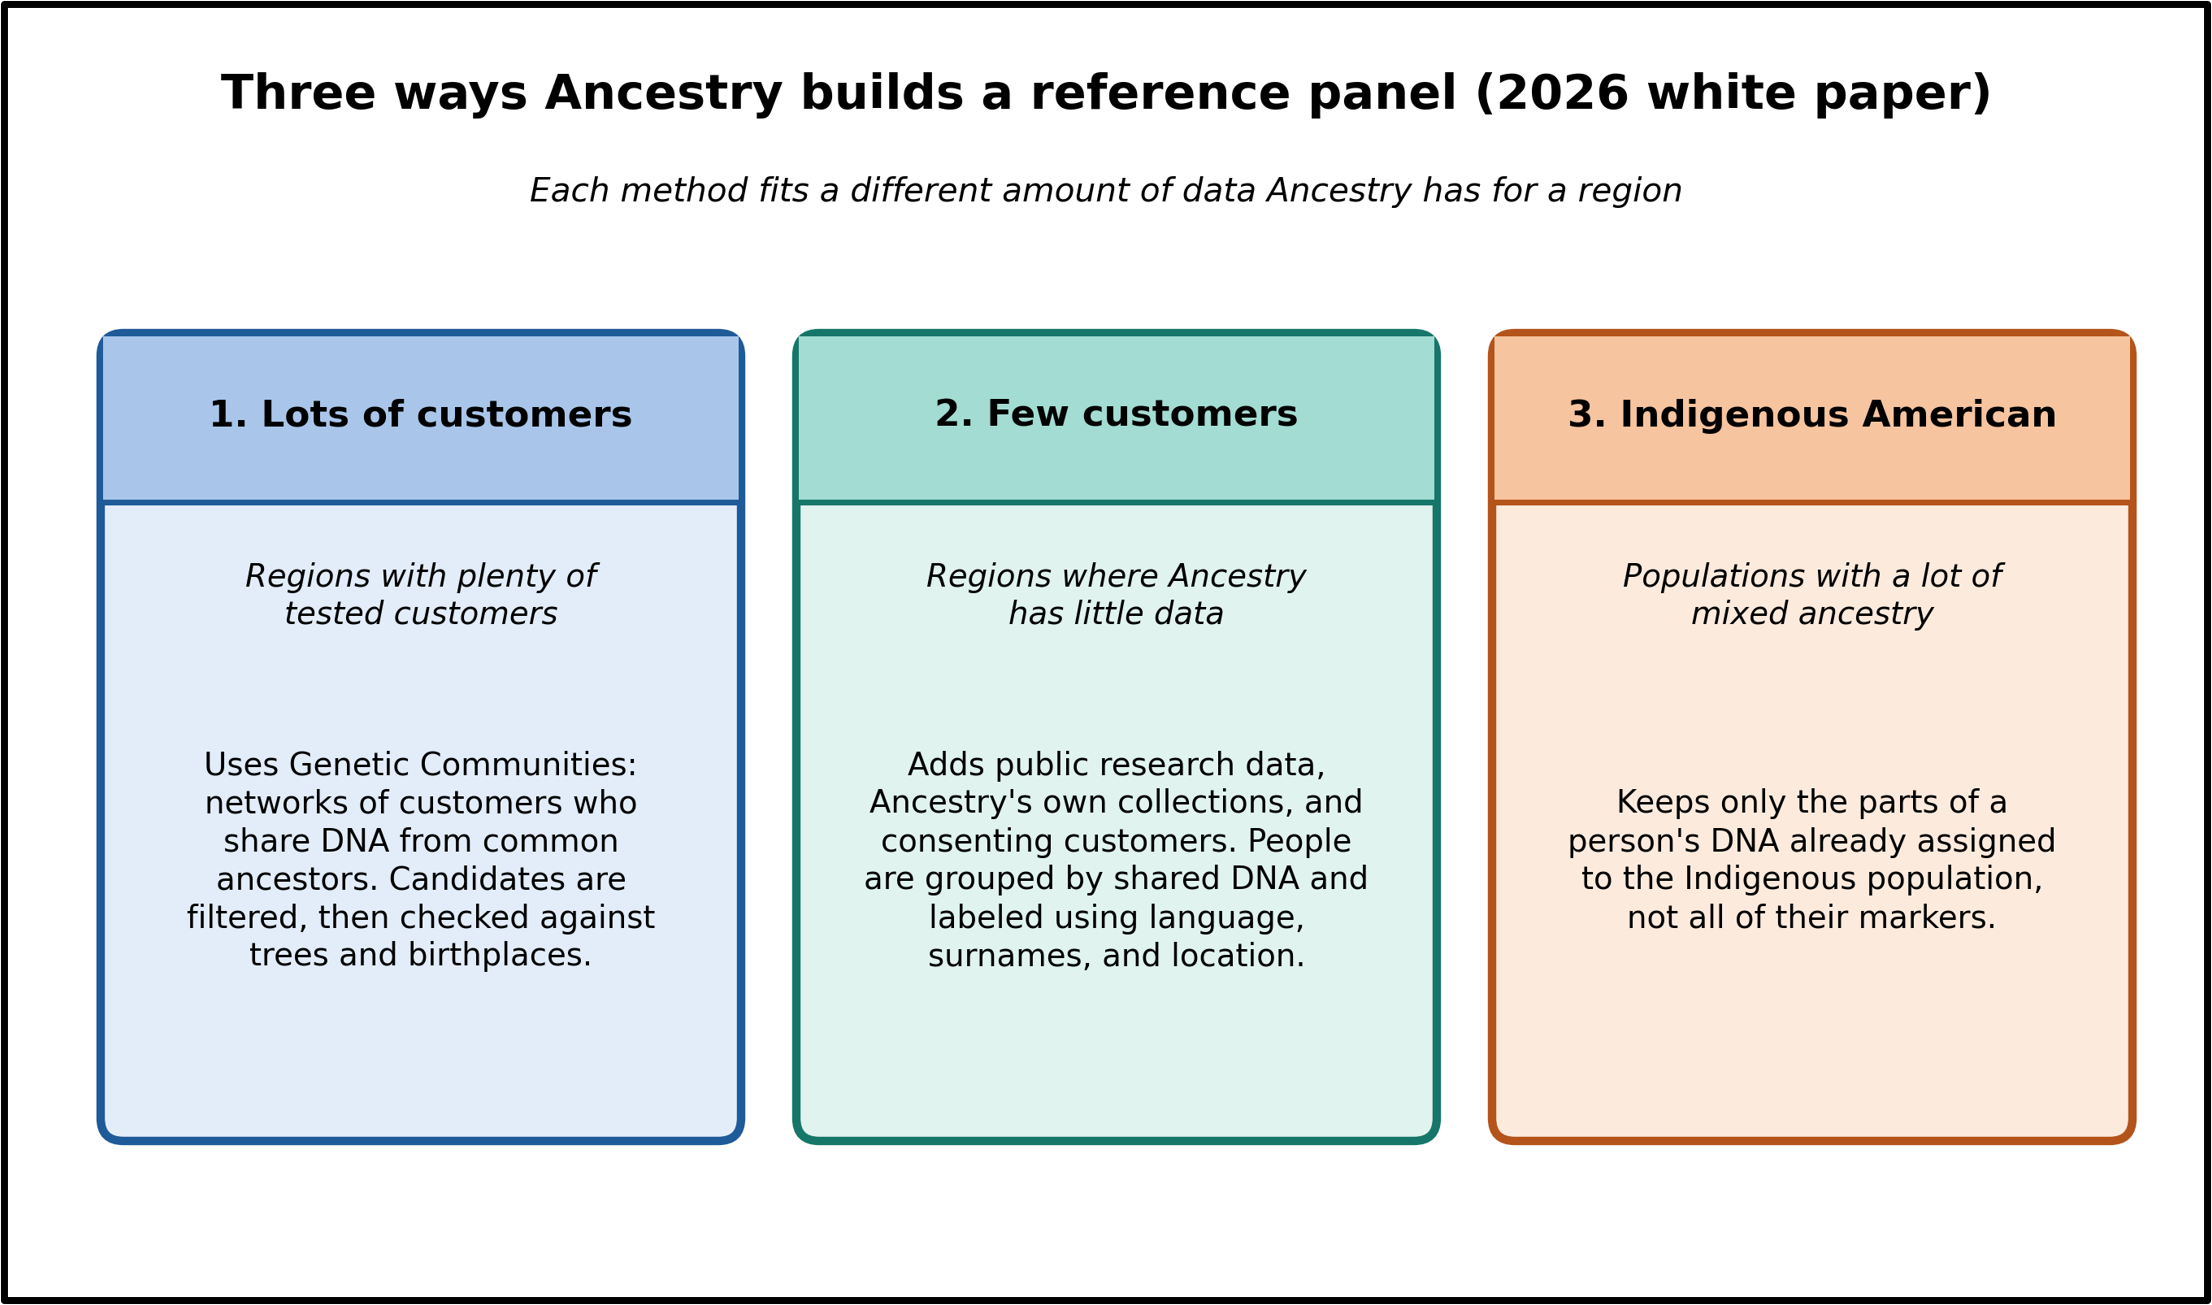
Figure 6. The three panel-building methods at a glance.
The 2026 panel is much larger. Ancestry reports more than 295,000 samples representing 302 regions, compared with 185,000 samples representing 146 regions in 2025 (Figure 7).[18] In library terms, Ancestry added roughly 110,000 books and 156 shelves, more than doubling its shelves. Ancestry’s customer database also grew, from more than 25 million to more than 29 million people.[19]
Your DNA did not change between 2025 and 2026, but the library Ancestry compares it against did. With more than twice as many reference panels, each part of your DNA has more places it can be assigned. A part that once went to the closest available panel may now find a better match on a new, more specific panel. One large region in your 2025 results may split into several smaller regions in 2026, and its percentage may be divided among them.
The shelves also hold more books. More reference samples give Ancestry a fuller picture of what DNA from each region looks like, which can make each comparison more reliable. However, more regions also mean more neighbors that look alike. When two reference panels hold very similar DNA, Ancestry has more difficulty placing a part of your DNA, and percentages may shift between neighboring regions from one update to the next.
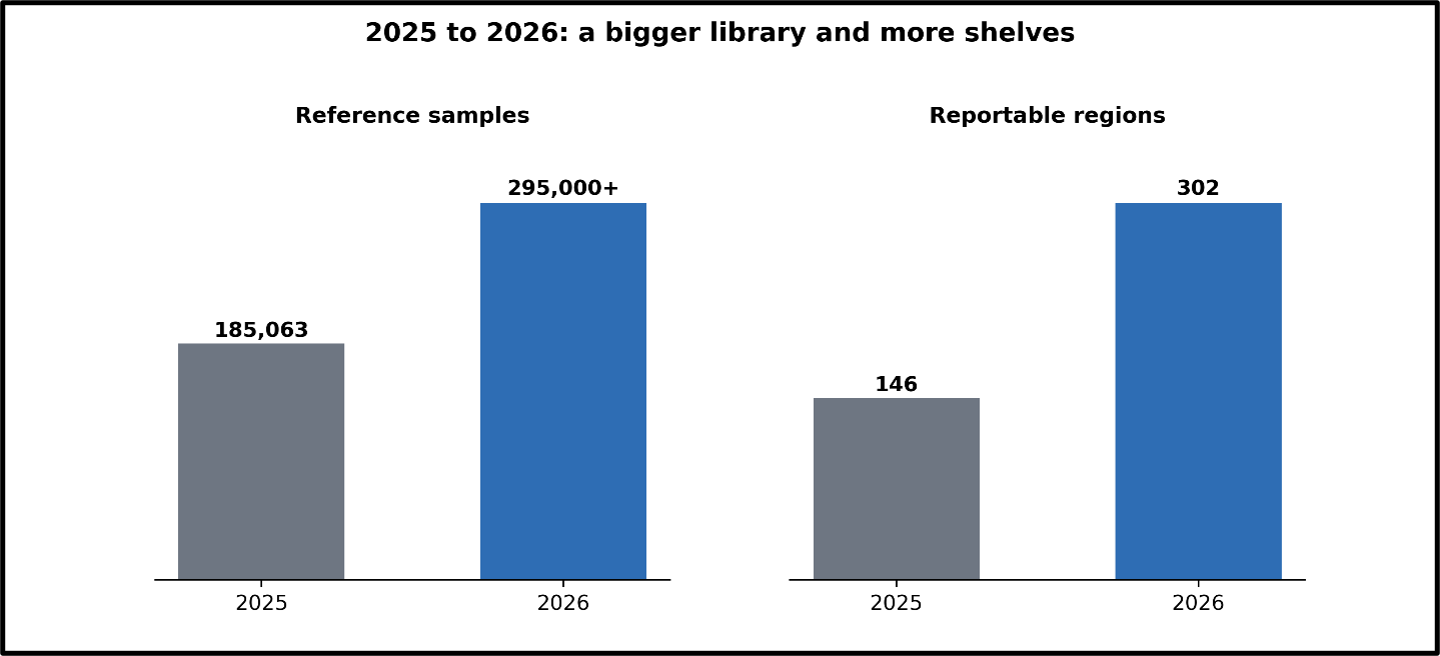
Figure 7. A bigger library and more shelves. Panel size grew by almost 60 percent. The region count more than doubled.
KEY TAKEAWAYS
A reference panel is a set of people whose DNA is typical of a place or population. When Ancestry changes the panel or redraws a region, your percentages can move even though your DNA did not.
Step 5: Compare each window to the panel, then narrow to a continent
With the library built, Ancestry can compare your DNA with it. Ancestry takes one small piece of your DNA, called a window, and holds the window up to every shelf (reference panel) (Figure 8). Ancestry asks, “Which reference panel does this window look most like?” and assigns the window to the closest match. Ancestry repeats the process for every window.[20]
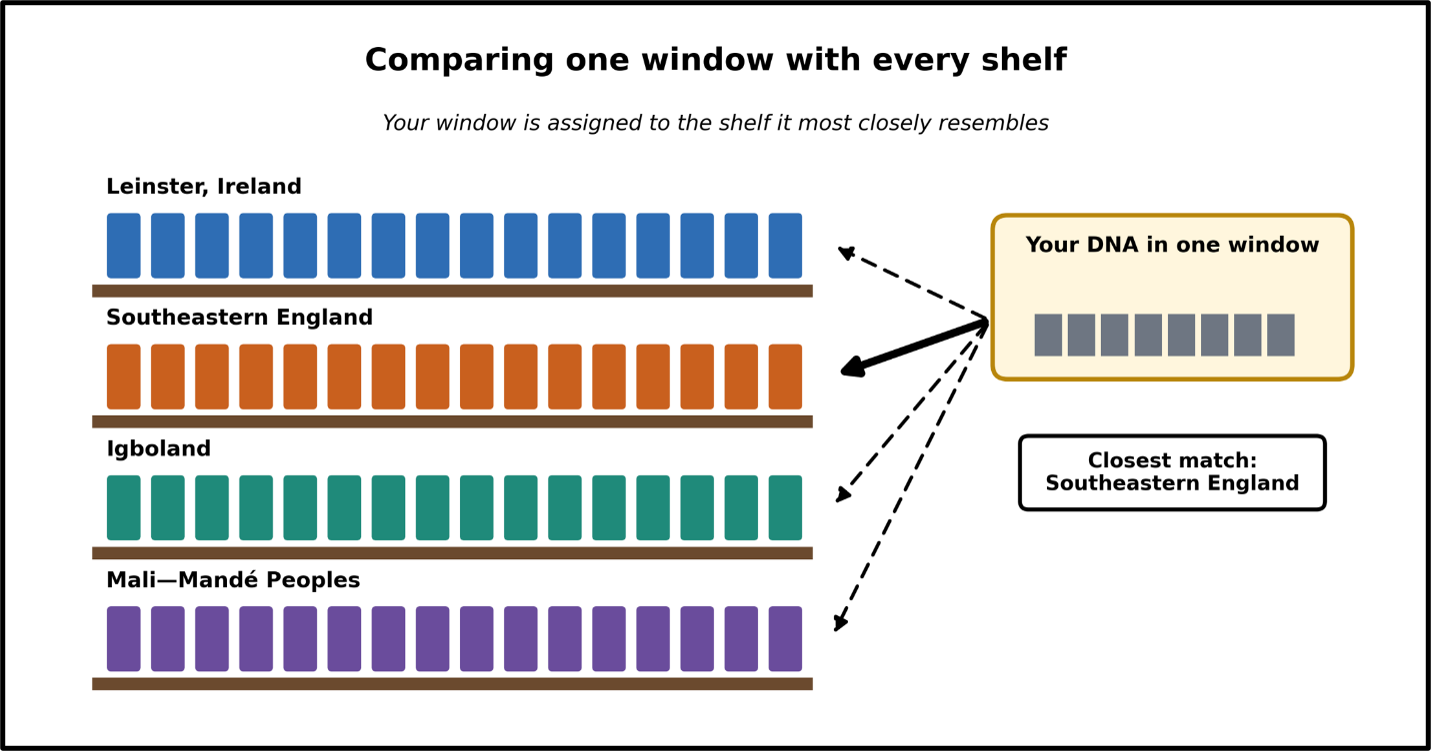
Figure 8. Each window of your DNA is compared with every shelf (reference panel) and assigned to the closest match.
The biggest change in 2026 is how Ancestry compares each window with the reference panel. In 2025, Ancestry studied each reference panel ahead of time and wrote a summary of the DNA patterns common on that panel and rare on others, called a haplotype cluster model.[21] Your window was compared with those summaries, not with the samples themselves. In 2026, Ancestry compares your window directly with the same window in each book on the shelf, meaning the DNA of individual reference panel members. Ancestry says this helps it pick up less common and more subtle patterns.[22]
Match length
Ancestry’s 2026 comparison rests on match length. Think of finding a passage in another book that reads word for word the same as yours. When you and a panel member inherited the same stretch of DNA from a shared ancestor, you carry identical DNA over some length. Each generation, recombination (the shuffling of DNA) breaks inherited stretches into shorter pieces. A long DNA length points to a more recent shared ancestor, and a short DNA length points to a more distant one. Longer DNA lengths count for more. A classifier, a computer program trained to sort information into groups, then turns the scored matches into a probability for each of the 302 regions.[23]
Genotyping errors
Ancestry also allows for genotyping errors, which are small mistakes in reading a SNP. A genotyping error works like a typo in the middle of a long matching book passage. Without some tolerance, one wrong letter would split a long match into two short ones and discard most of the match’s value. Ancestry’s scoring therefore stretches across a small number of disagreeing positions.[24]
Continent first, region second
With 302 regions, a window could be compared with hundreds of choices, and many reference panels sit side by side holding very similar samples.[25] To make the choice easier, the 2026 method works in two passes, much like finding the right section of a library before looking for the right shelf (Figure 9):
- Pass 1: Each window is sorted into a broad group, called a super-population, that roughly follows the continents.
- Pass 2: The windows in each group are gathered together, and the finer question is asked only among the regions inside that group.[26]
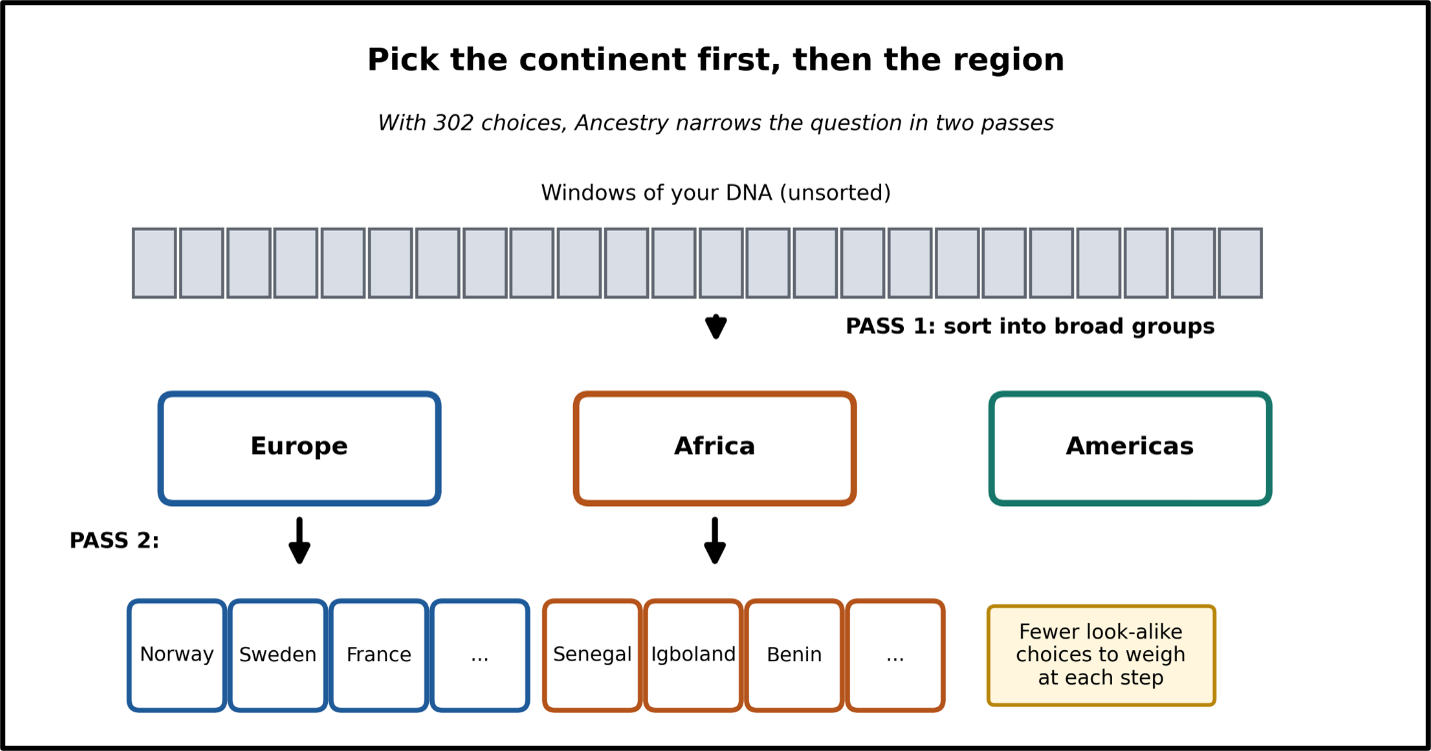
Figure 9. Pass 1 picks the continent-sized group. Pass 2 picks the region inside it.
KEY TAKEAWAYS
In 2026, each window is compared directly with individual people in the panel, and longer matches count for more. Ancestry picks the continent first, then the region, because telling close neighbors apart is the hard part.
Step 6: Smoothing the noise and fixing swapped parents
After Step 5, Ancestry has matched every window of your DNA to a reference panel. Think of each window as one page of your own book. Ancestry checked each page against the shelves on its own, without looking at the pages around it. One page by itself is weak evidence. Sometimes two reference panels match almost equally well, either because the two populations really share the same DNA there or by chance. If Ancestry simply took the best match for each page, the results would be messy, with region labels flipping back and forth in ways that probably are not real.[27]
Smoothing: reading the pages in order
Smoothing fixes this problem by reading the pages in order. DNA is passed down in long pieces, so neighboring windows usually come from the same place. If one page matched Igboland in the middle of a long chapter that matched Leinster, Ireland, that single page is more likely an error than a real change (Figure 10).[28]
In 2025, Ancestry smoothed with a hidden Markov model (HMM), a math tool that favors long runs of the same label.[29] The 2026 method uses a transformer instead, the same kind of AI model behind modern chatbots. Ancestry compares the job to reading a sentence. A single word can be unclear, but the word makes sense once you see the words around it.[30] Ancestry trained the transformer on examples where the right answer was already known. From those examples, the transformer learned how long the stretches from each population usually are and which pairs of populations are hard to tell apart. Ancestry smooths each parent’s DNA copy separately.[31]
Fixing swapped parents: putting pages back in the right volume
Your book is really two volumes, one from each parent. As explained in Step 2, phasing separates the two volumes, but phasing can accidentally swap pages between them partway along a chromosome (Figure 10). When that happens, a stretch from one parent’s volume ends up in the other parent’s volume. Ancestry looks for places where swapping the pages back makes both volumes read more consistently, and Ancestry makes those swaps both before and after smoothing. Where SideView™ has already worked out which parent a stretch came from, that information guides the fix.[32]
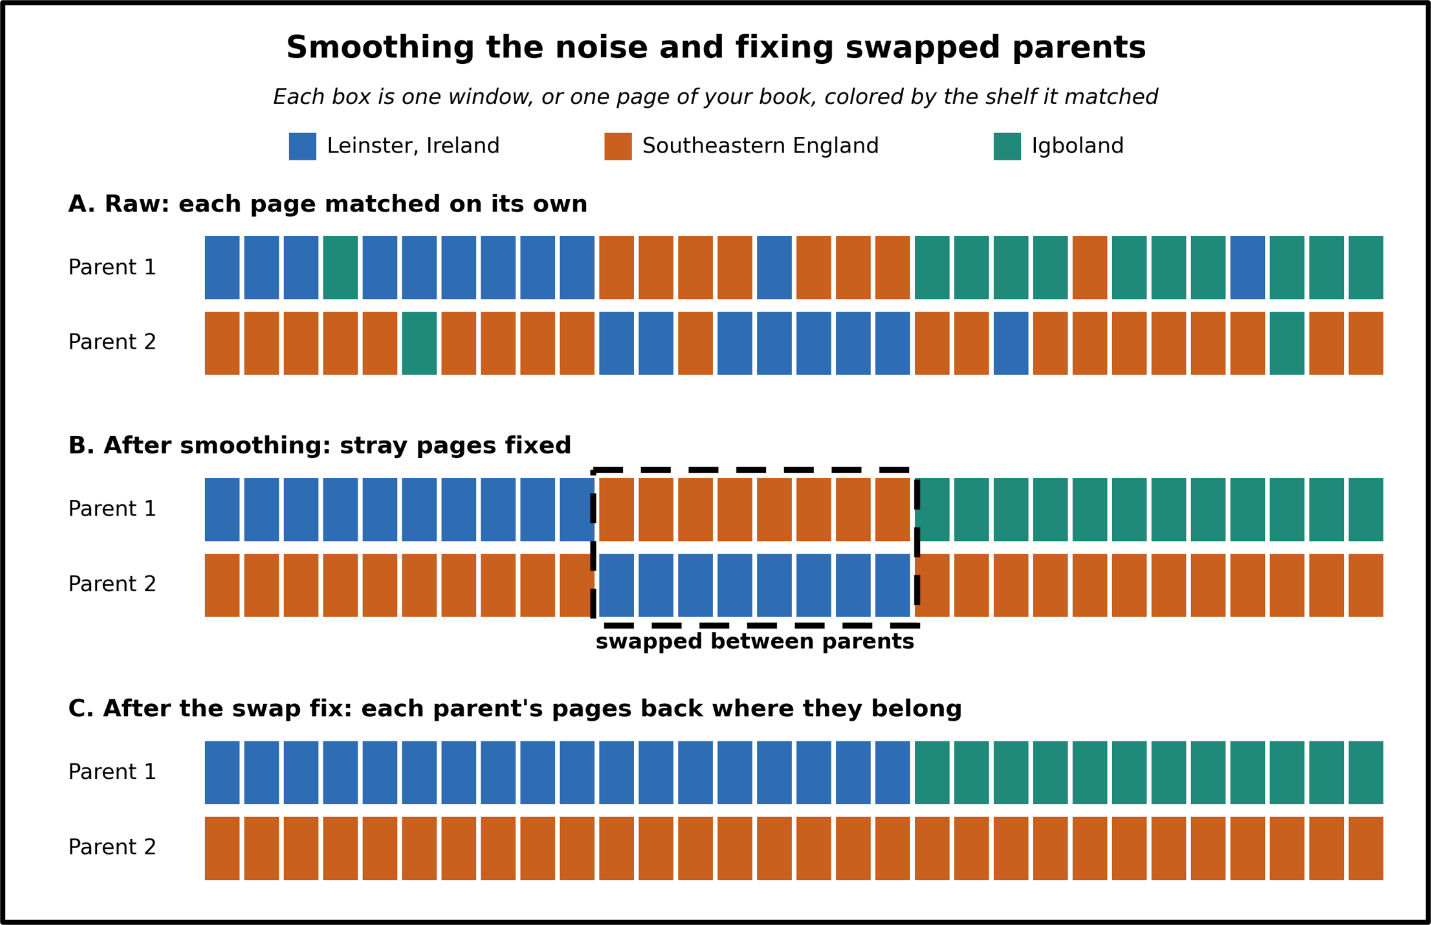
Figure 10. From noisy page-by-page matches to clean parental copies. The picture is a cartoon example.
KEY TAKEAWAYS
Smoothing and the swap fix clean up page-by-page mistakes. Because 2026 replaced the hidden Markov model with a transformer, the same DNA can come out smoothed differently.
Step 7: Totals, the cutoff, and the range
After filing every page, Ancestry counts how much of your book landed on each shelf. Each percentage is the total genetic length of the windows assigned to a region, divided by the length of the whole genome, with both parents’ copies added together.[33]
The cutoff: small shelves are left out
Ancestry does not report shelves that hold only a tiny share of your pages. Ancestry reports only the regions that reach a minimum share and divides the dropped share among the regions it does report, so the total adds up to 100 percent. The 2026 white paper does not state the minimum. Pages from the dropped shelves show up as Unassigned.[34]
The cutoff explains why small regions can come and go. The white paper notes that “a region sitting almost exactly at that minimum share can appear in one update and not in another due to chance.” This can happen even when the DNA evidence hasn’t changed.[35]
The range shows how much to trust a number
Each percentage also comes with a range. Think of the range as how sure the librarian is about the number of pages on a shelf. To build the ranges, Ancestry compares its estimates with the known answers for large groups of simulated people and measures how far off the estimates usually are. A reference panel with distinctive samples gets a narrow range. A panel whose samples look a lot like a neighbor’s gets a wide range, usually because those populations exchanged DNA over a long time (Figure 11).[36] In 2025, Ancestry built ranges a different way, using 1,000 alternative paths sampled from the hidden Markov model.[37]
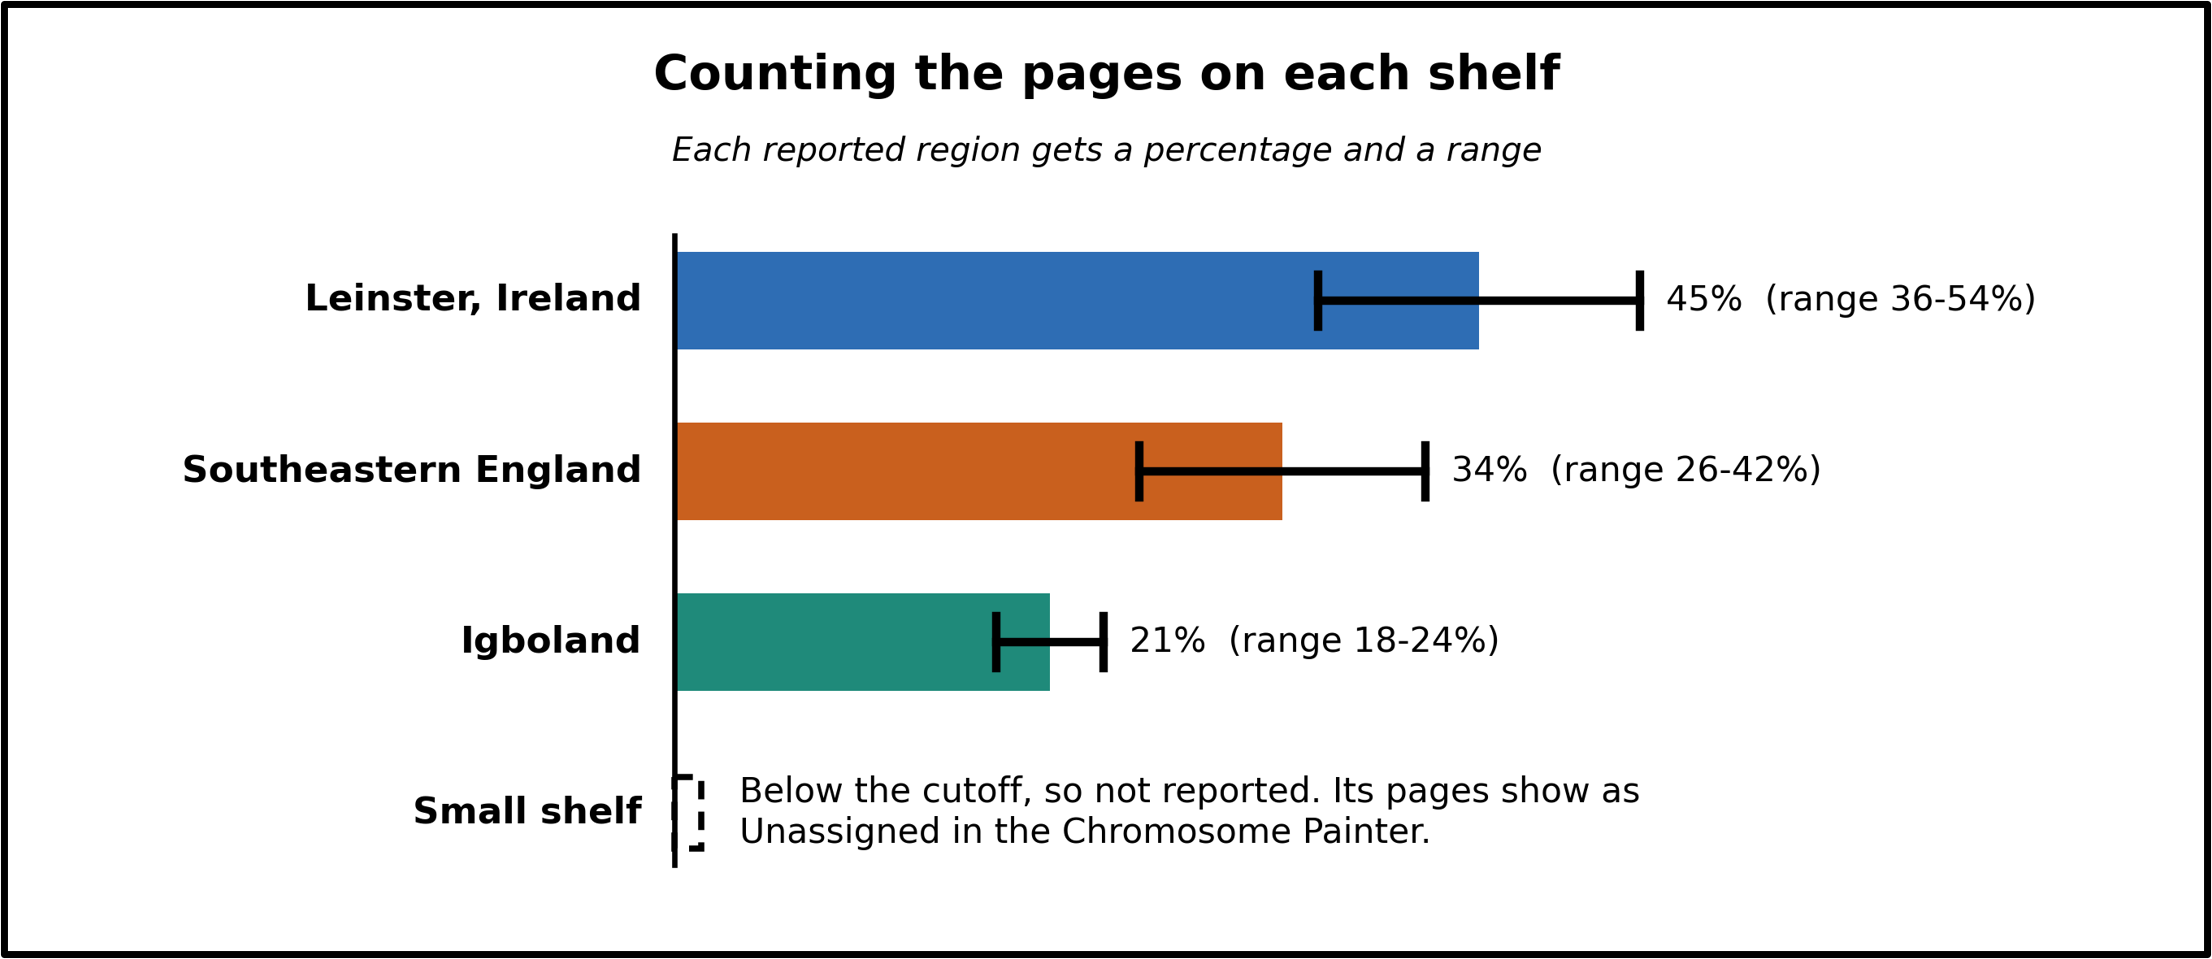
Figure 11. Each reported region gets a percentage and a range. Igboland looks less like the other two shelves, so its range is narrower. A shelf below the cutoff is not reported. The picture is a simplified example.
KEY TAKEAWAYS
The percentage is Ancestry’s best guess, and the range is its honesty check. Small regions near the cutoff can pop in and out between updates, so read the range before the number.
Questions that remain
The white papers give useful detail about Ancestry’s methods and internal tests, but some questions are still open. How much of the 2026 changes in your ancestral regions comes from the larger panel, the direct comparison, the transformer, or the revised region definitions? How well do the results work for populations with less representation or complex histories of mixing? How should customers interpret a high weighted precision when exact regional precision is lower? And how close are Ancestry’s internal simulations to the genealogy questions customers actually ask? These are not reasons to dismiss ethnicity estimates. They are reasons to read them at the level of certainty the evidence supports.
What changed from 2025 to 2026: A Quick Reference Guide
Both white papers describe the same basic idea: compare your DNA to a reference panel and report where it fits. The differences are in the panel, the comparison, the smoothing, and how the results are reported.
| What | 2025a | 2026b | Why it matters in plain English |
|---|---|---|---|
| Reportable regions | 146 | 302 | More categories give finer detail, but also more look-alike neighbors to tell apart. |
| Reference samples | 185,063 | Over 295,000 | A bigger library, up by almost 60%. Size helps, but who is in the library matters too. |
| Customers in Ancestry’s database | Over 25 million | Over 29 million | More relatives for phasing and for building panels. |
| SNPs used for the region estimate | About 300,000 | About 400,000 | More data points per comparison. |
| Windows | 1,001 | “A large number” (not stated) | The 2026 paper does not say how many windows it uses. |
| How windows are compared to the panel | Haplotype cluster model, a summary built from about 50,000 people | Direct comparison to individual panel members, using match length | Direct comparison can catch rarer, subtler patterns, because nothing is boiled down to a summary first. |
| How a region is chosen | All regions weighed together | Two passes: continent-sized group first, then regions inside it | Fewer look-alike choices to weigh at each step. |
| Smoothing | Hidden Markov model | AI transformer | A different tool decides which stray windows are noise. |
| Fixing swapped parents | Built into the hidden Markov model | Separate step before and after smoothing | Better chance of keeping each parent’s story together. |
| Ranges | From 1,000 sampled model paths | From measured error in simulated people with known ancestry | Ranges now rest on tests against known answers. |
| Small regions | Not described | Dropped below a minimum share and redistributed; windows shown as “Unassigned” | Tiny regions can appear or vanish between updates by chance. |
| How accuracy is reported | Mean overlap, recall, and precision; counts regions at 5% or more | Medians; counts regions at 2.5% or more; adds “weighted precision” | The two sets of scores are measured differently, so do not compare them directly. |
| Parent-separation tool | SideView™ | SideView™, plus a later update Ancestry calls “SideView 2.0” (not described in either paper) | Results may reflect two changes at once. We cannot separate them. |
| a Rekha Angara, et al “Ancestral Regions 2025 White Paper,” 9 Oct 2025, pp. 1, 7, 8,24,17, 19, 21. b Rekha Angara, et al., “Ancestral Regions 2026 White Paper,” 8 Oct 2026, pp. 1, 3, 7, 10-18, 25. |
|||
Part 2: Step-By-Step Process for Analyzing Your Ancestral Regions
Part 2 will detail a step-by-step process for analyzing your DNA ancestral regions, using my dad, Ellis Green Guiles’, DNA ethnicity results as an example.
[1] “Key Differences Between Ancestral Regions and Journeys,” Ancestry (https://help.ancestry.com/hc/en-us/articles/53933315233939-Key-Differences-Between-Ancestral-Regions-and-Journeys : accessed 11 Oct 2026).
[2] Rekha Angara, et al., “Ancestral Regions 2025 White Paper,” 9 Oct 2025, p. 8.
Rekha Angara, et al., “Ancestral Regions 2026 White Paper,” 8 Oct 2026, p. 11.
[3] “AncestryDNA® Regions List,” Ancestry (https://www.ancestry.com/ethnicity/all-regions : accessed 13 Oct 2026).
[4] “Ethnicity & Origin,” Ancestry (https://www.ancestry.com/ethnicity/all-regions : accessed 13 Oct 2026).
[5] “Key Differences Between Ancestral Regions and Journeys,” Ancestry (https://help.ancestry.com/hc/en-us/articles/53933315233939-Key-Differences-Between-Ancestral-Regions-and-Journeys : accessed 11 Oct 2026).
“AncestryDNA Update Transforms Results With New Regions and Macro-Regions,” 9 Oct 2025, Ancestry (https://www.ancestry.com/c/ancestry-blog/ancestry-news/ancestrydna-update-transforms-results-with-new-regions-and-macro : accessed 13 Oct 2026).
[6] “AncestryDNA Regions and Journeys FAQ,” Ancestry (https://help.ancestry.com/hc/en-us/articles/53933322469779-AncestryDNA-Regions-and-Journeys-FAQ : accessed 13 Oct 2026).
[7] “AncestryDNA® Regions List,” Ancestry (https://www.ancestry.com/ethnicity/all-regions : accessed 13 Oct 2026).
[8] AncestryDNA Regions and Journeys FAQ,” Ancestry (https://help.ancestry.com/hc/en-us/articles/53933322469779-AncestryDNA-Regions-and-Journeys-FAQ : accessed 13 Oct 2026).
[9] “Uncover your African heritage in rich detail,” Ancestry (https://www.ancestry.com/c/explore/african-heritage#: accessed 12 Oct 2026).
[10] Rekha Angara, et al., “Ancestral Regions 2025 White Paper,” 9 Oct 2025, p. 15.
Rekha Angara, et al., “Ancestral Regions 2026 White Paper,” 8 Oct 2026, p. 11.
[11] Rekha Angara, et al., “Ancestral Regions 2025 White Paper,” 9 Oct 2025, p. 15.
Rekha Angara, et al., “Ancestral Regions 2026 White Paper,” 8 Oct 2026, p. 7.
[12] Robin Wirthlin, “AncestryDNA SideViewTM,” 29 May 2022, FamilyLocket (https://familylocket.com/ancestrydna-sideview/ : accessed 12 Oct 2026).
[13] Rekha Angara, et al., “Ancestral Regions 2026 White Paper,” 8 Oct 2026, pp. 15-16.
[14] Rekha Angara, et al., “Ancestral Regions 2025 White Paper,” 9 Oct 2025, p. 14.
[15] Rekha Angara, et al., “Ancestral Regions 2026 White Paper,” 8 Oct 2026, p. 10.
[16] Rekha Angara, et al., “Ancestral Regions 2026 White Paper,” 8 Oct 2026, p. 2.
[17] Rekha Angara, et al., “Ancestral Regions 2026 White Paper,” 8 Oct 2026, pp.3-7.
[18] Rekha Angara, et al., “Ancestral Regions 2025 White Paper,” 9 Oct 2025, p. 8.
Rekha Angara, et al., “Ancestral Regions 2026 White Paper,” 8 Oct 2026, p. 11.
[19] Rekha Angara, et al., “Ancestral Regions 2025 White Paper,” 9 Oct 2025, p. 3.
Rekha Angara, et al., “Ancestral Regions 2026 White Paper,” 8 Oct 2026, p. 3.
[20] Rekha Angara, et al., “Ancestral Regions 2026 White Paper,” 8 Oct 2026, p. 11.
[21] Rekha Angara, et al., “Ancestral Regions 2025 White Paper,” 9 Oct 2025, p. 17.
[22] Rekha Angara, et al., “Ancestral Regions 2026 White Paper,” 8 Oct 2026, p. 10.
[23] Rekha Angara, et al., “Ancestral Regions 2026 White Paper,” 8 Oct 2026, pp. 11-12.
[24] Rekha Angara, et al., “Ancestral Regions 2026 White Paper,” 8 Oct 2026, pp. 12-13.
[25] Rekha Angara, et al., “Ancestral Regions 2026 White Paper,” 8 Oct 2026, p. 13.
[26] Rekha Angara, et al., “Ancestral Regions 2026 White Paper,” 8 Oct 2026, pp. 13-14.
[27] Rekha Angara, et al., “Ancestral Regions 2026 White Paper,” 8 Oct 2026, p. 14.
[28] Rekha Angara, et al., “Ancestral Regions 2026 White Paper,” 8 Oct 2026, p. 14.
[29] Rekha Angara, et al., “Ancestral Regions 2025 White Paper,” 9 Oct 2025, pp. 15-19.
[30] Rekha Angara, et al., “Ancestral Regions 2026 White Paper,” 8 Oct 2026, pp. 10, 14.
[31] Rekha Angara, et al., “Ancestral Regions 2026 White Paper,” 8 Oct 2026, p. 15.
[32] Rekha Angara, et al., “Ancestral Regions 2026 White Paper,” 8 Oct 2026, pp. 15-16.
[33] Rekha Angara, et al., “Ancestral Regions 2026 White Paper,” 8 Oct 2026, p. 16.
[34] Rekha Angara, et al., “Ancestral Regions 2026 White Paper,” 8 Oct 2026, p. 16.
[35] Rekha Angara, et al., “Ancestral Regions 2026 White Paper,” 8 Oct 2026, p. 16.
[36] Rekha Angara, et al., “Ancestral Regions 2026 White Paper,” 8 Oct 2026, p. 25.
[37] Rekha Angara, et al., “Ancestral Regions 2025 White Paper,” 9 Oct 2025, p. 19.





Leave a Reply
Thanks for the note!